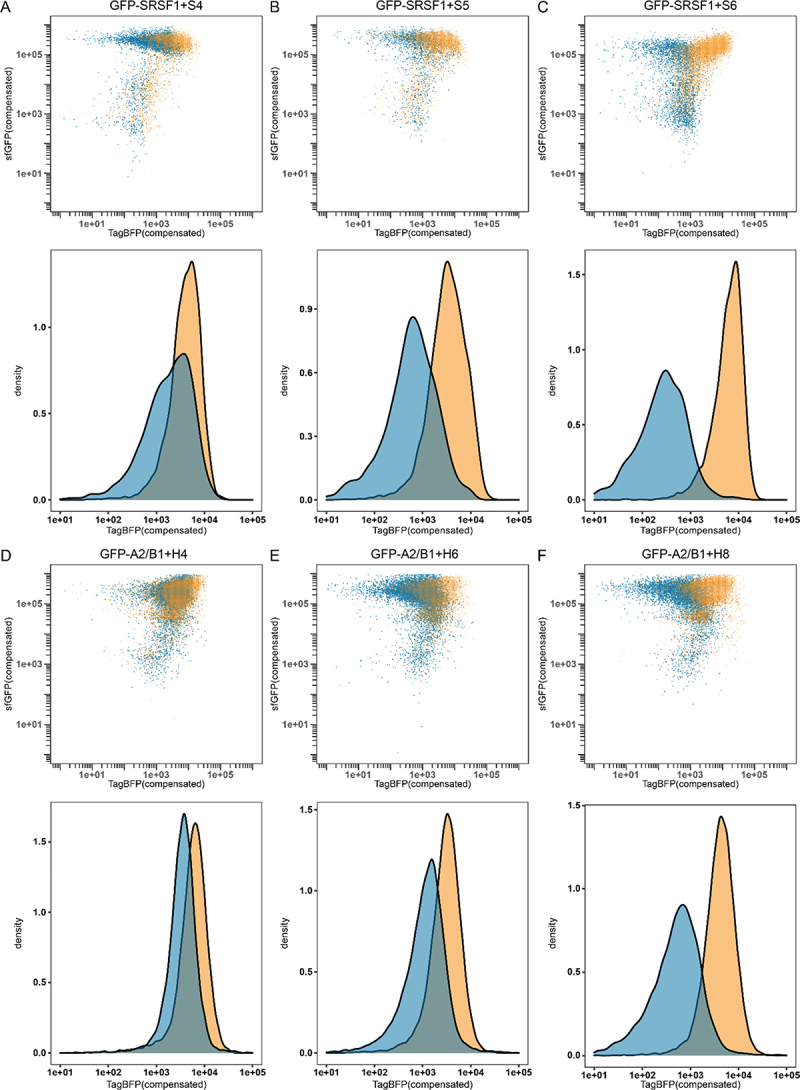
Figure 5.

Flow cytometry results for GFP-SRSF1 (blue) or GFP-PTBP1 (orange) in combination with reporter S4 (A), reporter S5 (B) or reporter S6 (C). As well as GFP-A2/B1 (blue) or GFP-PTBP1 (orange) in combination with reporter H4 (D), reporter H6 (E), or reporter H8 (F). Density graphs were produced by analysing all events >1e05 in the sfGFP channel.
