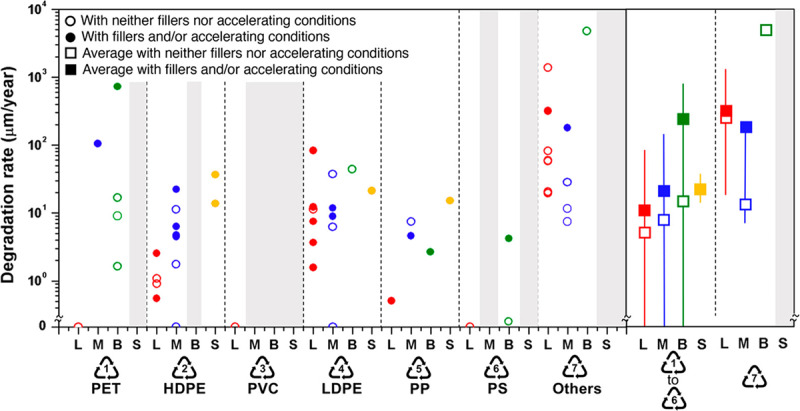
Figure 3.2.

Degradation rates for various plastics. “Vertical columns represent different environmental conditions (L, landfill/compost/soil; M, marine; B, biological; S, sunlight) and plastic types (represented by their resin identification codes). Plastics type 7, “others”, corresponds to various nominally biodegradable plastics. The range and average value for plastic types 1–6 are shown on the right as lines and squares, respectively, as well as for biodegradable “others”. Data points representing degradation rates that were unmeasurably slow are shown on the x-axis. Gray columns represent combinations for which no data were found.” PET, polyethylene terephthalate; HDPE, high-density polyethylene; PVC, polyvinyl chloride; LDPE, low-density polyethylene; PP, polypropylene; PS, polystyrene. Figure caption and figure reprinted with permission from (Chamas et al., 2020) [240] (CC BY 4.0).
