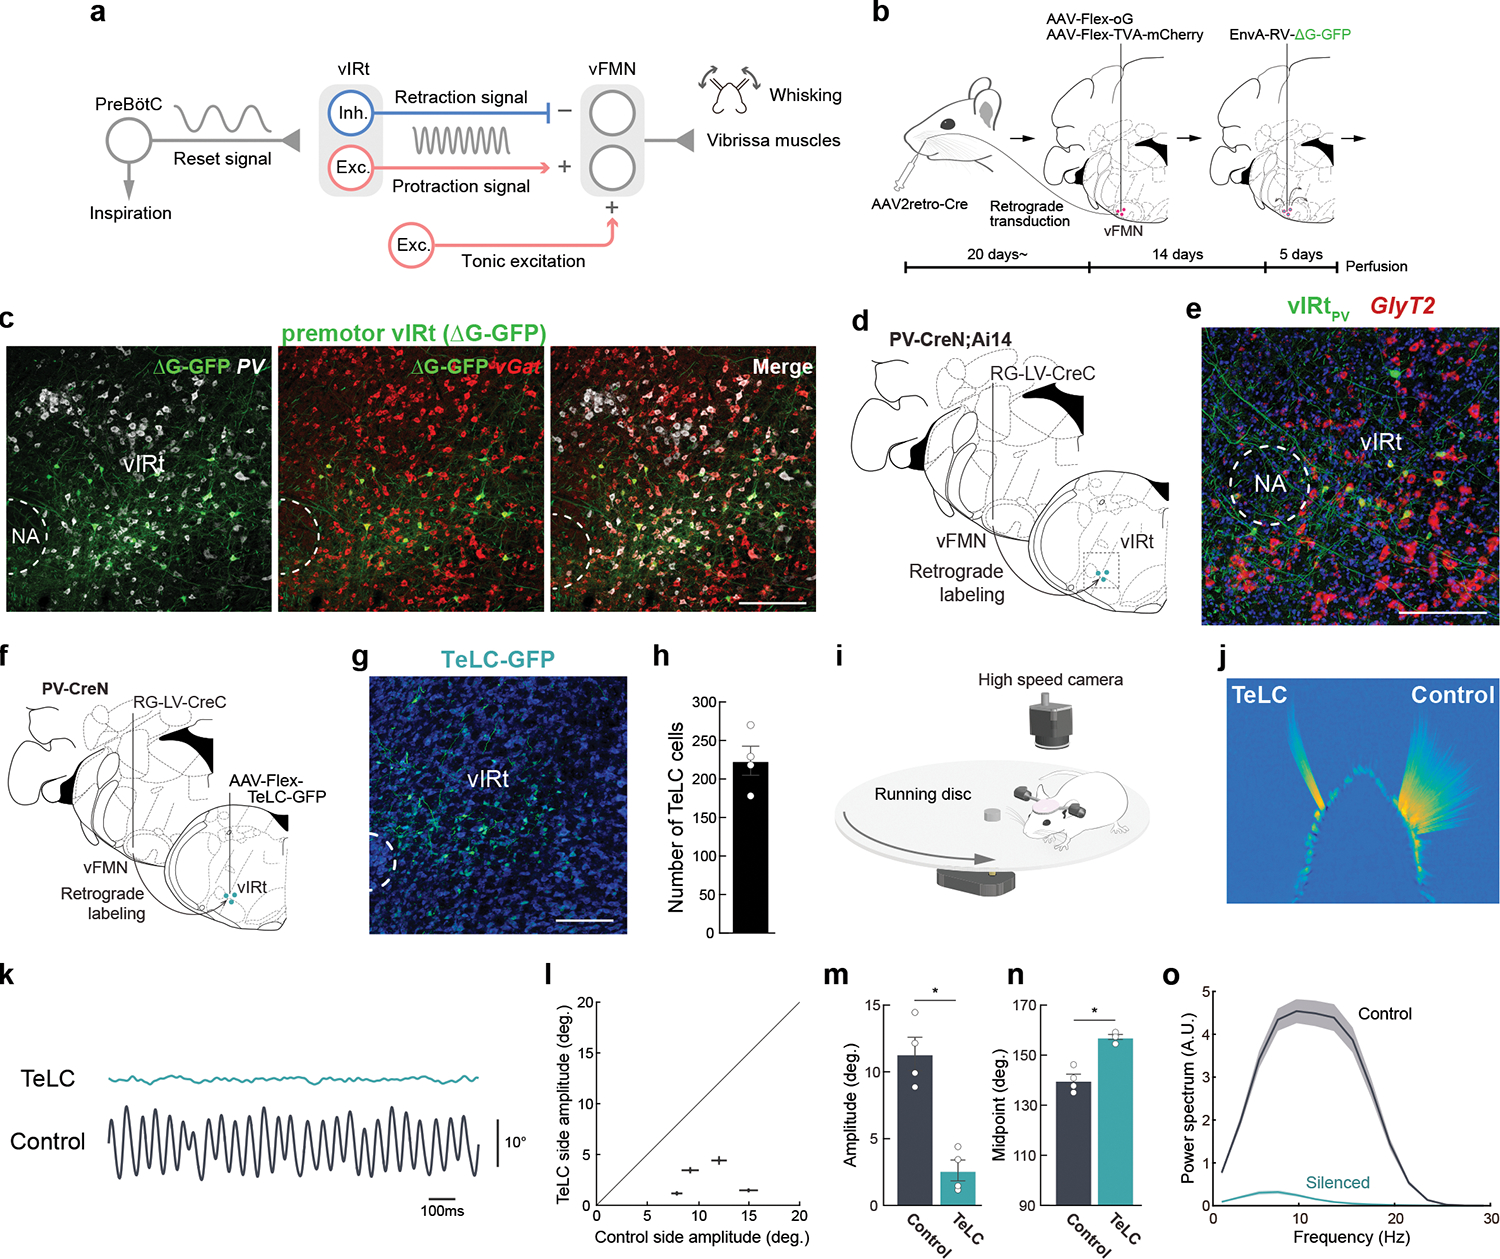
Fig. 1. Molecular and functional characterization of PV+ premotor vIRt neurons.

a, Diagram of the proposed whisking generation circuit in the brainstem. B, A three-step monosynaptic rabies virus tracing strategy to label adult vibrissa premotor circuit. C, Representative image of vibrissa premotor neurons in vIRt. PV and vGat mRNA were detected by HCR RNA-FISH. D, Viral-genetic split-Cre strategy for labeling PV+ premotor vIRt neurons. Retrograde lentivirus carrying CreC (RG-LV-CreC) is injected into the vibrissal part of the facial motor nucleus (vFMN) of the PV-CreN;Ai14 animal. Functional Cre is reconstituted only in vibrissal premotor neurons expressing PV. e, Molecular characterization of vIRtPV neurons. vIRtPV neurons expressing tdTomato (shown in green) overlap with GlyT2 (red, 87.9 ± 1.4%, n = 3). f, Strategy for expressing TeLC in vIRtPV neurons using the same split-cre strategy. g, Post hoc histological assessment of TeLC-GFP expression. h, Quantification of TeLC-GFP expressing cells in vIRt (223.8 ± 18.9, n = 4). i, Experimental setup for vibrissa tracking. j, A superimposed image of tracked vibrissae (C2, Left; TeLC-silenced, Right; Control). k, Representative vibrissa angle traces (green; TeLC-silenced, black; Control. Whisking midpoint was subtracted. Protraction is up). l, Plot of whisking amplitude of the TeLC-silenced and control sides. Dots represent individual animals. m, Quantification of whisking amplitude (Control side, 11.4 ± 1.2°; TeLC side, 2.6 ± 0.8°, n=4) n, Quantification of whisking midpoint (Control side, 140.0 ± 2.4°; TeLC side, 157.3 ± 1.0°, n=4.) o, Power spectrum analysis of whisking frequency. Shaded areas are mean ± s.e.m. Data are mean ± s.e.m. * P ≤ 0.05, KS test (m, n). Brain sections were counterstained with Neurotrace Blue (c, g) or DAPI (e). Scale bars, 200 μm.
