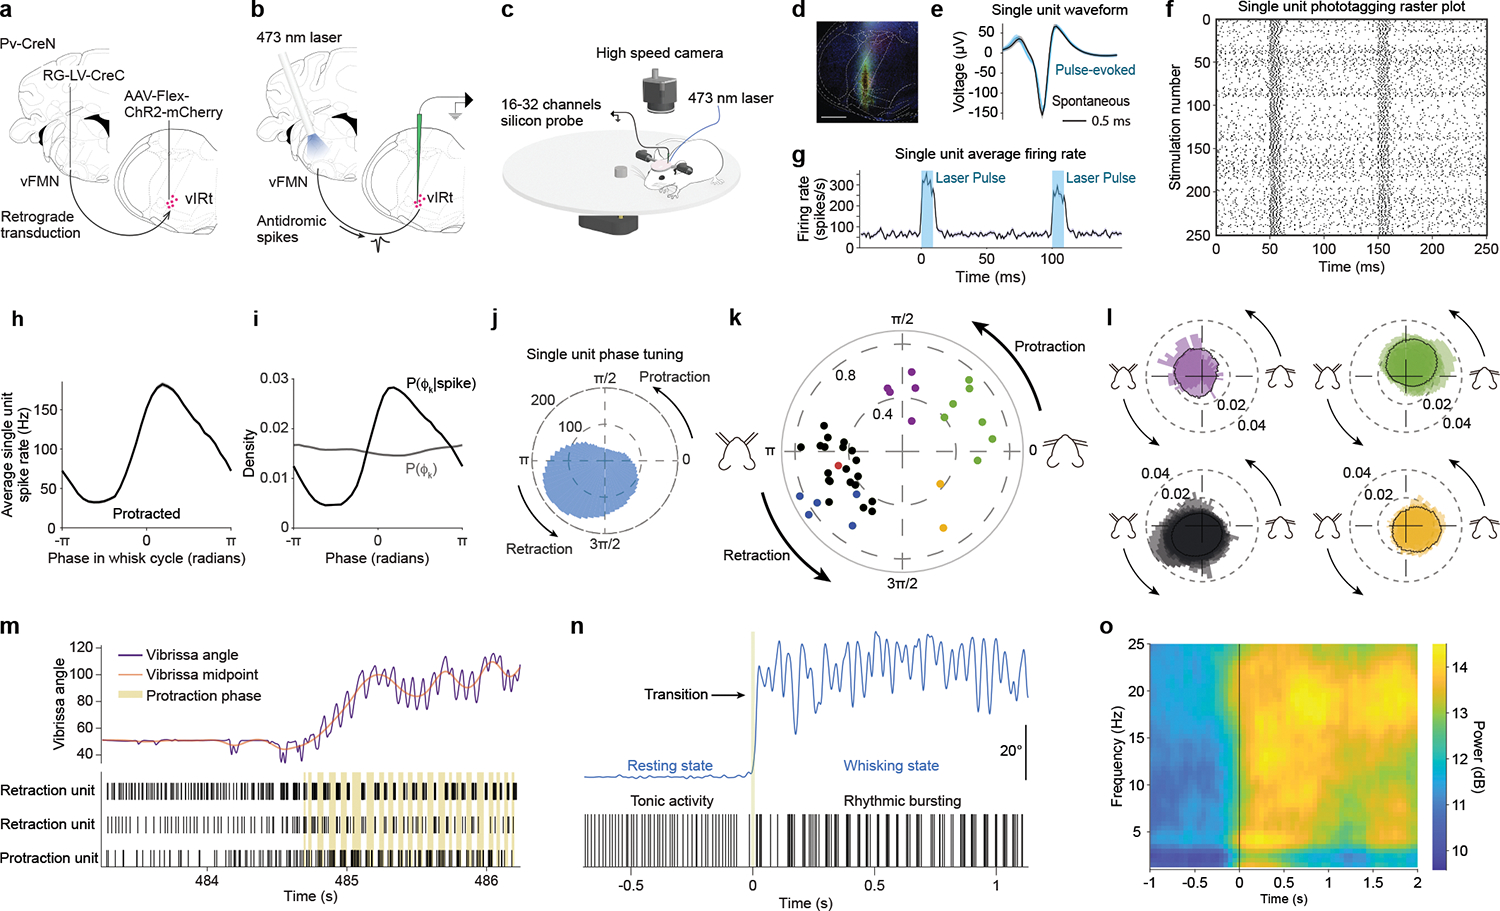
Fig. 2. Response characteristics of vIRtPV premotor neurons during whisking behavior.

a, Viral-genetic strategy for expressing ChR2 in vIRtPV neurons. b, Opto-tagging strategy. c, Recording and behavioral setup. d, Histological verification of ChR2 expression and recording location. e, f, g, Spike waveform, raster plot, and average laser stimulation response of a opto-tagged single unit. h, i, j, Whisking phase tuning of a opto-tagged single unit. h, Average spike rate across whisking phases. i, Probability of a whisking phase to occur for a given spiking event (black) and probability of each whisking phase (grey). j, Phase tuning for that cell, in polar coordinates. Magnitude in spikes per second. k, Peak magnitude and phase of spike/phase coherence for all tuned cells. Color coding: Black/blue/red, Retraction units; Yellow, Mid-Retraction units; Green, Protraction units; Purple, Mid-Protraction units. Opto-tagged units are shown in blue or red (ChR2 or ChRmine-expressing cells, respectively). l, Normalized average firing rate of Retraction (bottom left), Mid-Retraction (bottom right), Protraction (top right) and Mid-Protraction (top left) groups, expressed as a probability value for each phase bin. Color coding as in k. m, Transition from tonic to rhythmic activity pattern. Top: vibrissa angle trace (purple), overlayed with vibrissa midpoint trace (red). Bottom: raster plot for two retraction and one protraction units. Beige bands mark each protraction phase. n, A high magnification representation of the tonic to rhythmic transition that occurs for a retraction-tuned unit going from resting state to whisking movements. o, Mean time-frequency spiking spectrum for all retraction units, aligned to transition from resting to whisking.
