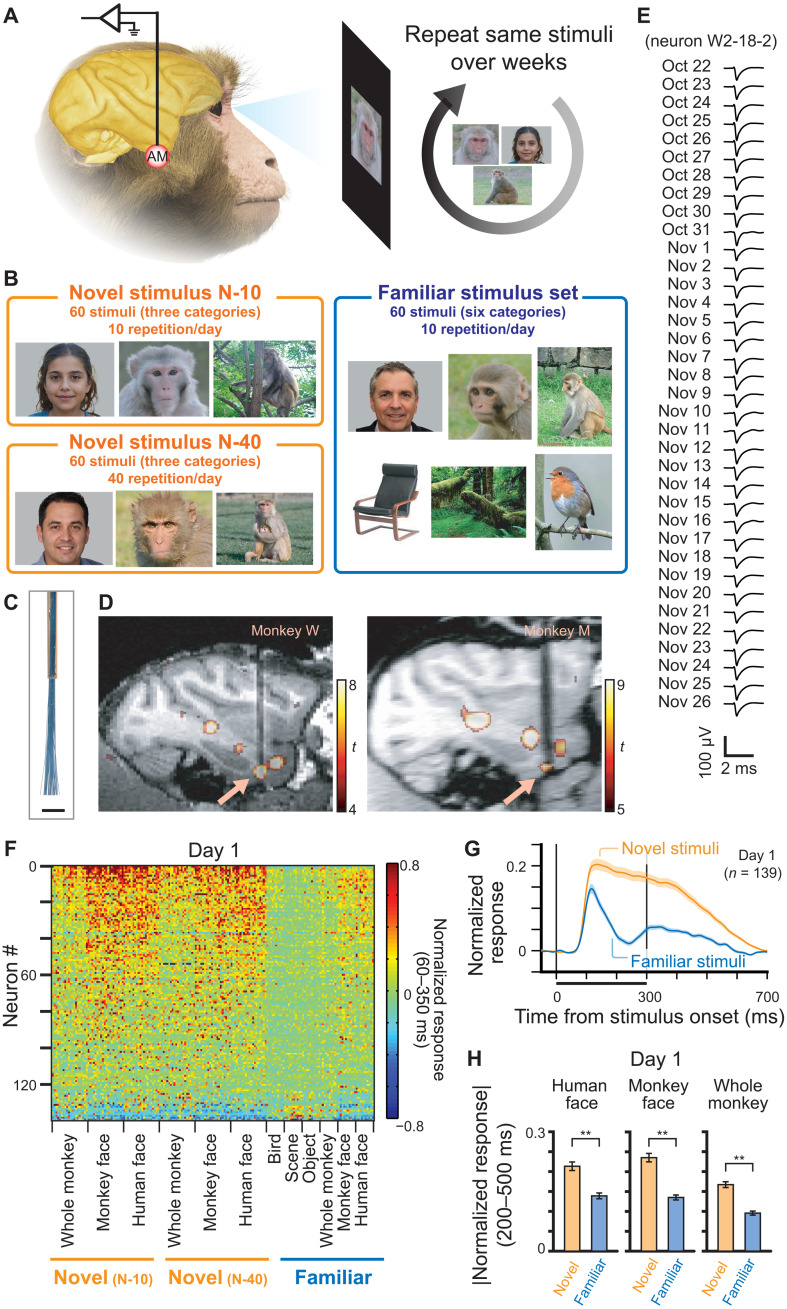
Fig. 1. Experimental design and population response to the stimuli.
(A) Overview of the experiment. Neurons were recorded from AM face patch, while stimuli were repeatedly shown to the monkeys over the course of 2 to 5 weeks. (B) Three categories (novel N-10, novel N-40, and familiar) of visual stimuli. (C) Electrode tip of the microwire brush array. Scale bar, 1 mm. (D) Recording location of each monkey, shown in sagittal section of MRI. Arrows indicate AM face patch. (E) Example waveform of a neuron recorded over 36 days. (F) Response of recorded neurons to each stimulus on the first day of the recording. Neurons were sorted according to the response to face stimuli compared to other stimuli. (G) Time course of responses to novel and familiar stimuli (human face, monkey face, and whole monkey) on the first day. Shaded area indicates standard error from mean (SE). (H) Average response to each category of stimulus on the first day during the late sustained response. Ordinate, absolute value of normalized responses. Error bars indicate SE. **P < 10−14, paired t test; t138 = 8.95 (human face), 9.79 (monkey face), and 11.85 (whole monkey). Because of privacy right reasons, we display mock stimulus images for human faces in A and B, which were generated by artificial intelligence (https://this-person-does-not-exist.com/en).

