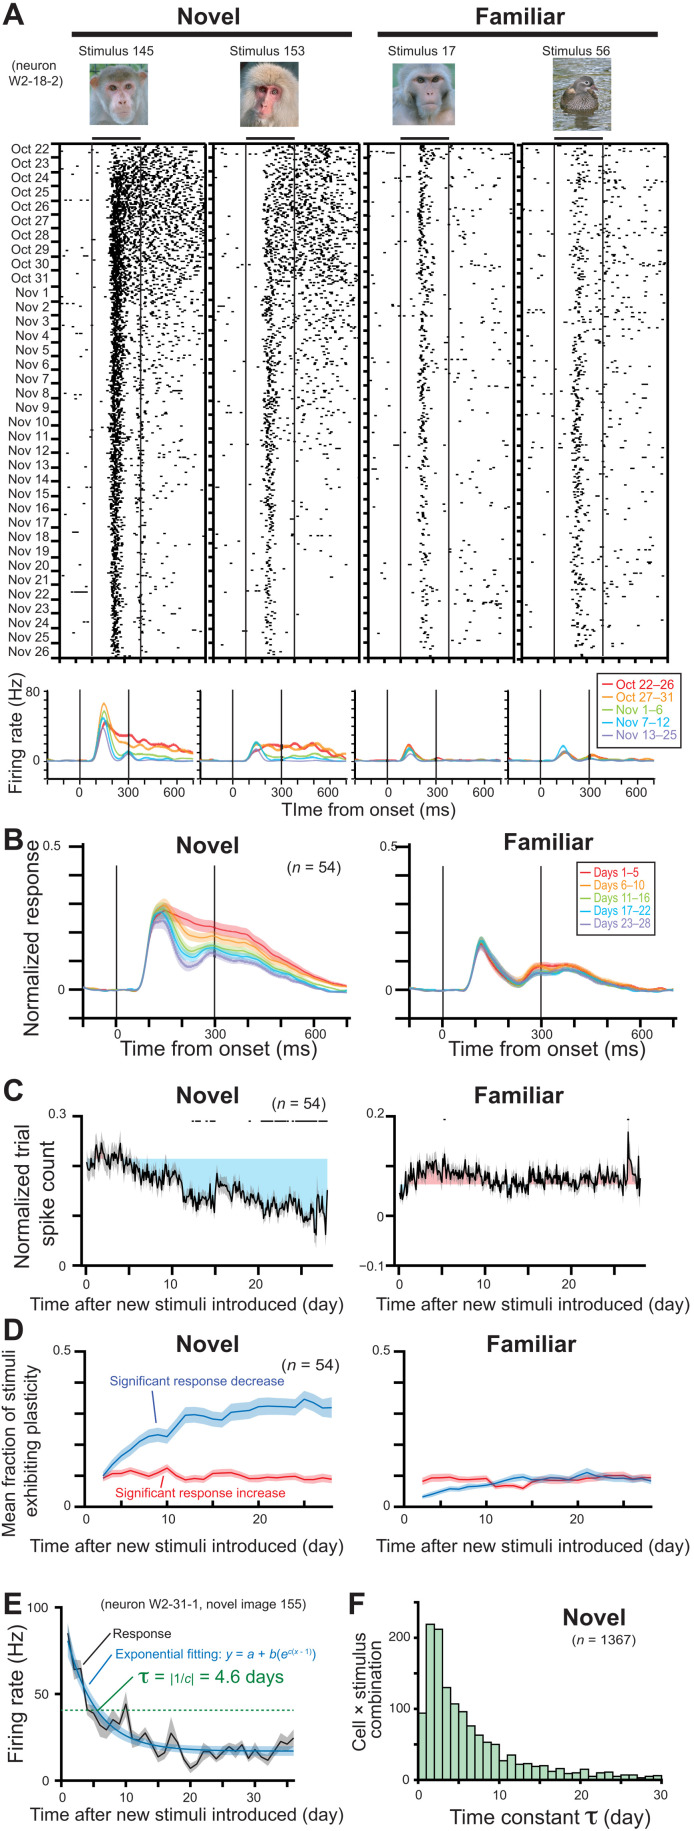
Fig. 2. Decrease of late, sustained responses over multiple days of visual exposure to initially novel stimuli.
(A) Response of an example neuron over five weeks of recording, showing adapting responses to novel (left) but not familiar (right) stimuli. (B) Population-averaged spike density functions for novel (N-10) and familiar stimuli. Responses are normalized with response to the best stimulus and baseline activity. (C) Change of response during late sustained period of 200 to 500 ms from stimulus onset over 4 weeks. All presentation trials are plotted in order, with days indicated at bottom. Black dots on the top indicate trials whose responses are significantly different from the responses of first 2 days (paired t test, P < 0.05 with Bonferroni correction). Gray shaded area indicates SE from mean. Colored shaded area indicates difference from mean response of first 2 days. (D) Mean fraction of stimuli showing significant population response changes from first 2 days (t test, P < 0.05). (E) An example of exponential fitting and computation of τ for response changes for a given neuron × stimulus combination across the extended recording session. (F) Distribution of time constants τ for all neuron × stimulus combinations in the novel (N-10) stimulus set.

