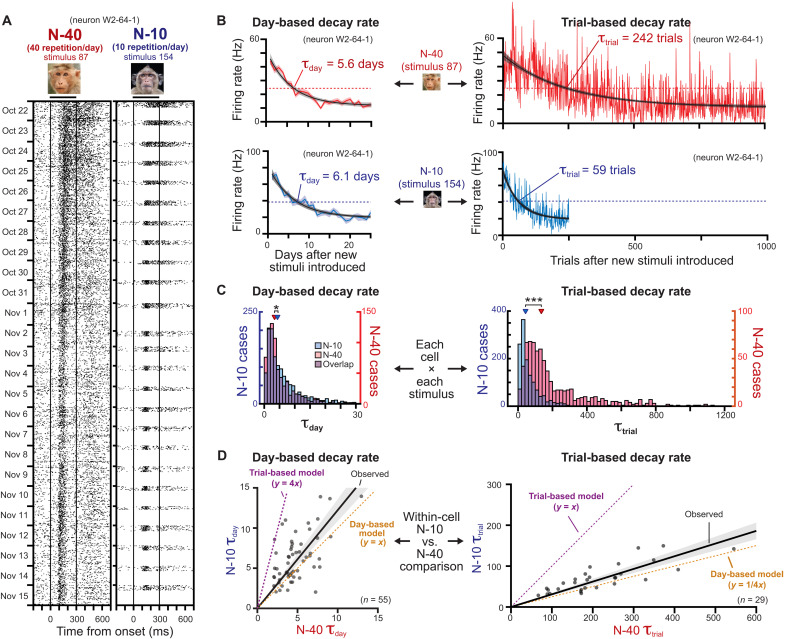
Fig. 3. Primary factor of day on the rate of visual response plasticity.
(A) Response change of an example neuron for one of N-40 and N-10 stimuli. (B) Exponential fitting used to calculate day-based (left) and trial-based (right) decay rates. Top two plots: Example for the N-40 stimulus. Bottom two plots: Example for the N-10 stimulus. The good correspondence between day-based decay rates and divergent trial-based decay rates for the N-40 and N-10 stimuli indicate that day is the critical factor. (C) Population distribution of estimated decay rates for each cell × stimulus combination. Left: Day-based decay rate (τday). Right: Trial-based decay rate (τtrial). *P < 10−5 and ***P < 10−122, Mann-Whitney U test. (D) Within-cell comparison between N-10 and N-40 stimuli. Each dot represents a cell. The τ values of each cell are the mean of all the stimuli with valid exponential fit. The black regression line is calculated from observed τ with a linear regression model y = ax.

