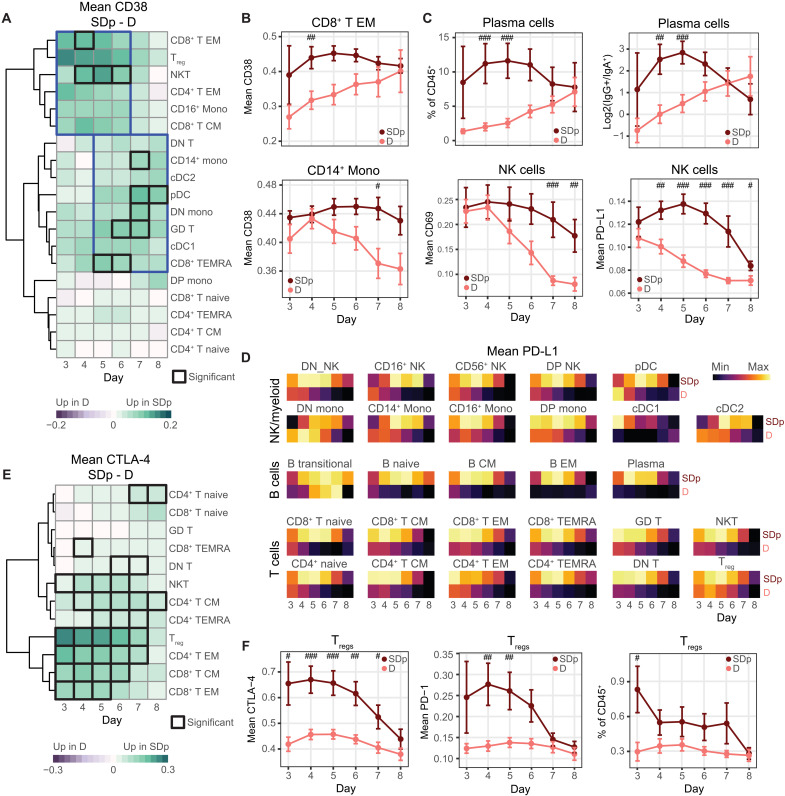
Fig. 6. The temporal switch of innate and adaptive immune activation and concurrent immune regulation is dysregulated in SDp.
(A and E) Difference in cohort mean of patient mean CD38 (A) and CTLA-4 (E) expression between SDp and D across cell populations (rows) by day (columns). Black boxes depict significance (P < 0.05 and |effect| > 1.0). Blue boxes group time points and populations with similar trends. (B) Cohort mean of patient mean CD38 expression in CD8+ T EM (top) and CD14+ monocytes (bottom) by clinical status and day. (C) Cohort mean of plasma cell abundance (top center), log2 ratio of IgG+ to IgA+ plasma cell abundance (top right), and mean CD69 (bottom left) and PD-L1 (bottom right) expression in NK cells by clinical status (color) and day (columns). (D) Cohort mean of patient mean PD-L1 expression (color) by day (columns) and clinical status (rows), separated by cell population (tiles). Each tile is individually scaled. (F) Cohort mean of patient mean CTLA-4 (left) and PD-1 (center) expression in Tregs and abundance of Tregs (right) by clinical status and day. #P < 0.05 and |effect| > 1.0; ##P < 0.01 and |effect| > 1.0; ###P < 0.005 and |effect| > 1.0 by Wilcoxon rank sum tests. Error bars represent SEM.

