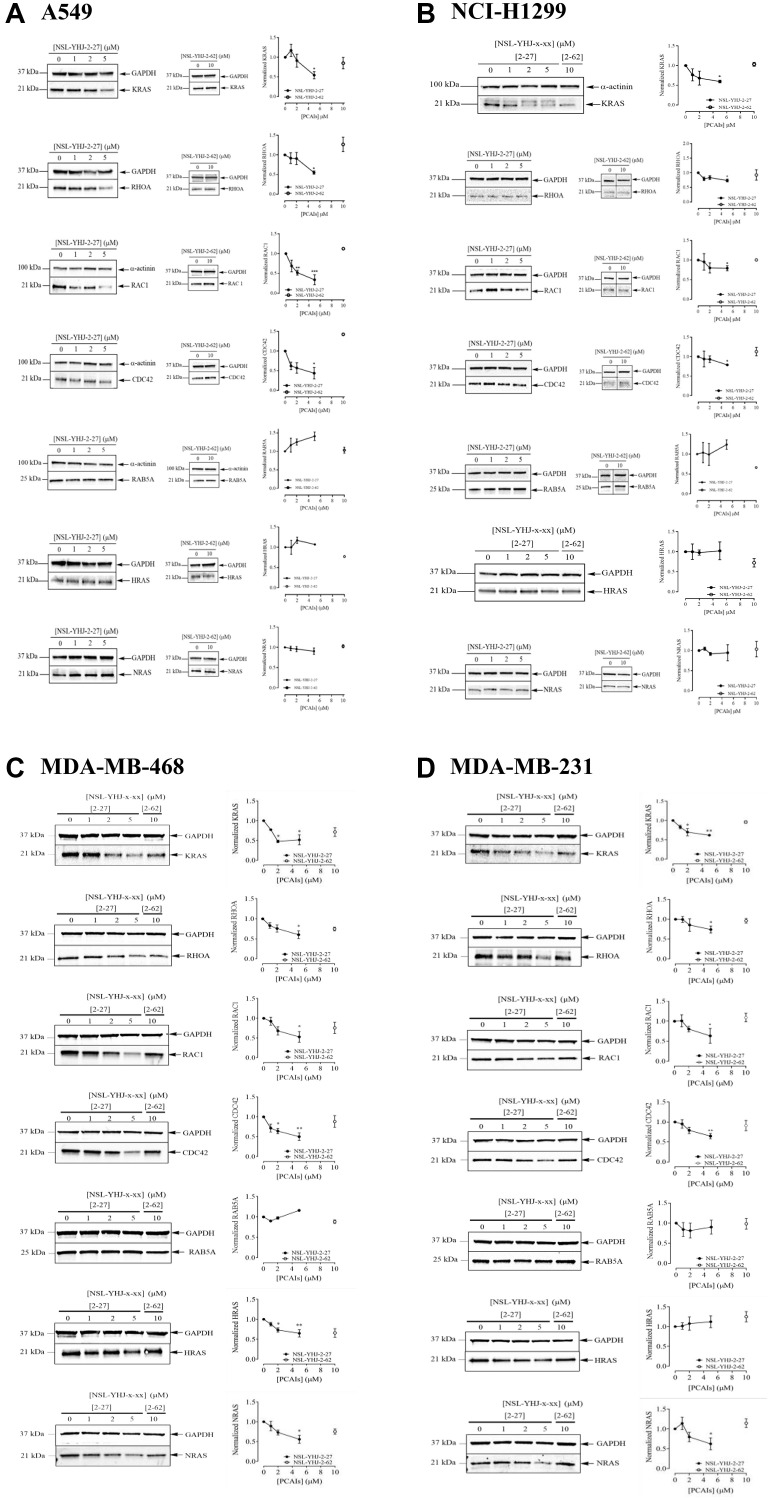
Figure 3. The effect of PCAIs on G-protein levels.
Cells were treated for 48 h with 0−5 μM of NSL-YHJ-2-27 (or NSL-YHJ-x-xx where x-xx is 2-27) or 10 μM of its non-farnesylated analog, NSL-YHJ-2-62 (or NSL-YHJ-x-xx where x-xx is 2-62). These were then lysed and subjected to western blot analysis for G-protein levels as described in the methods. (A–D) Western blot images and densitometry plots of bands following quantification using Image Lab Software were normalized against GAPDH or α-Actinin. The samples were analyzed for G-protein levels of expression in (A) A549 (B) NCI-H1299 (C) MDA-MB-468 and (D) MDA-MB-231 cell lines. Data are representative of three independent experiments. Statistical significance (* p < 0.05, ** p < 0.01, and *** p < 0.001) was determined by 1-way ANOVA with post hoc Dunnett’s test.

