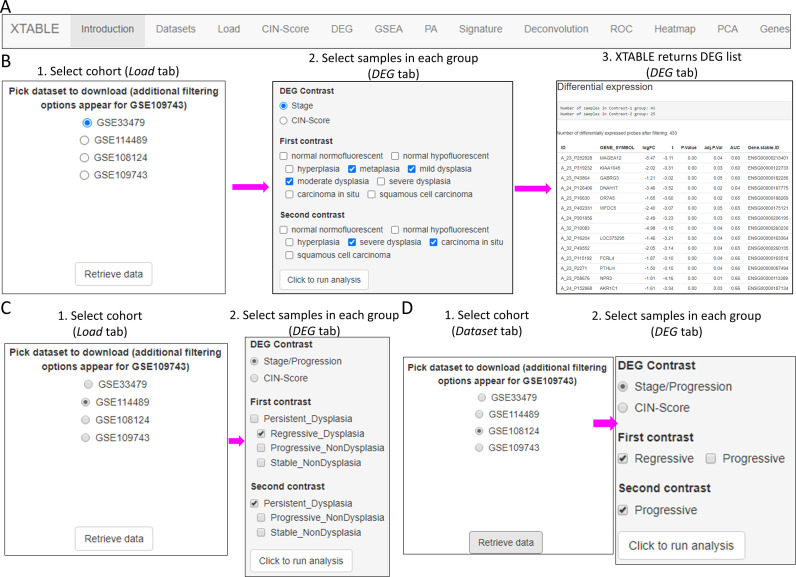
Figure 2. Overall organization of XTABLE (Exploring Transcriptomes of Bronchial Lesions) functions and use of the DEG function.
(A) Organization of all the functions in the XTABLE interface. The functions are interrelated and completing certain analyses requires the use of several functions. For instance, the GSEA and PA functions operate with gene lists obtained with the DEG function. (B) Workflow to obtain differentially expressed genes between two groups using the DEG function. The example shows groups of samples arranged by developmental stage to compare low-grade and high-grade premalignant lesions (PMLs) in the GSE33479 cohort. (C and D) Workflow to obtain differentially expressed genes between two groups using the DEG function. The two groups have been arranged by progression status using in the GSE114489 and GSE108124 cohorts, respectively.
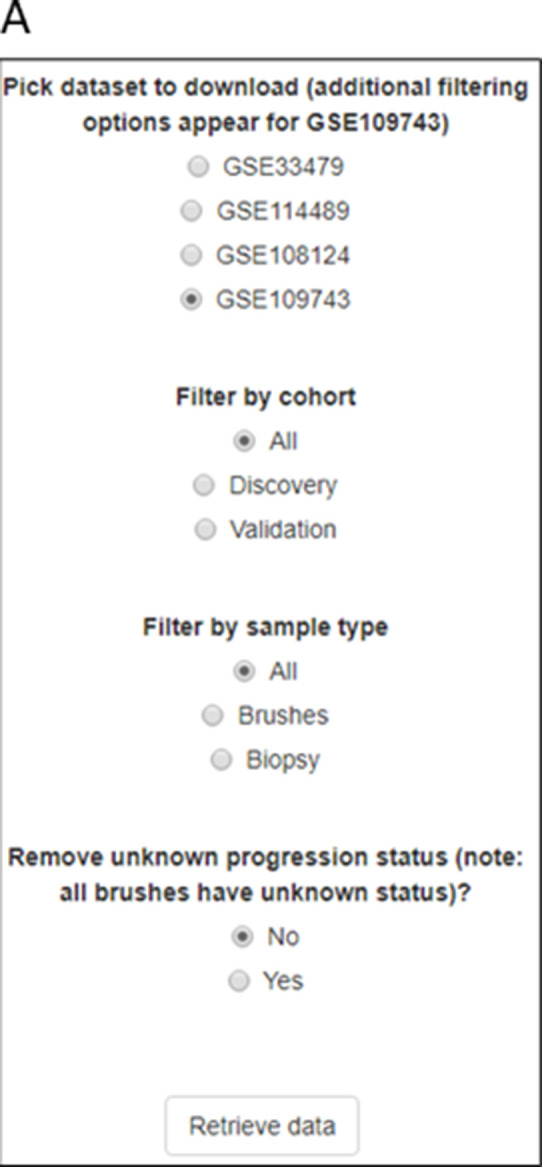
Figure 2—figure supplement 1. Sample selection options for cohort GSE109743.


