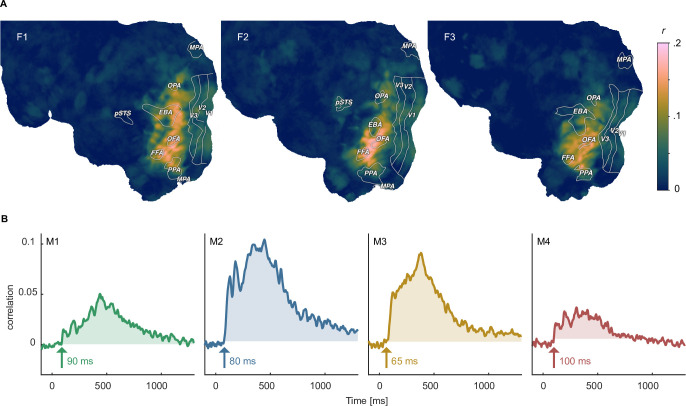
Figure 7. Identifying shared representations between brain and behavior.
(A) Pearson correlation between perceived similarity in behavior and local fMRI activity patterns using searchlight representational similarity analysis. Similarity patterns are confined mostly to higher visual cortex. (B) Pearson correlation between the perceived similarity in behavioral and time-resolved MEG activation patterns across sensors using representational similarity analysis. The largest time window of timepoints exceeding a threshold are shaded. The threshold was defined as the maximum correlation found during the baseline period.

