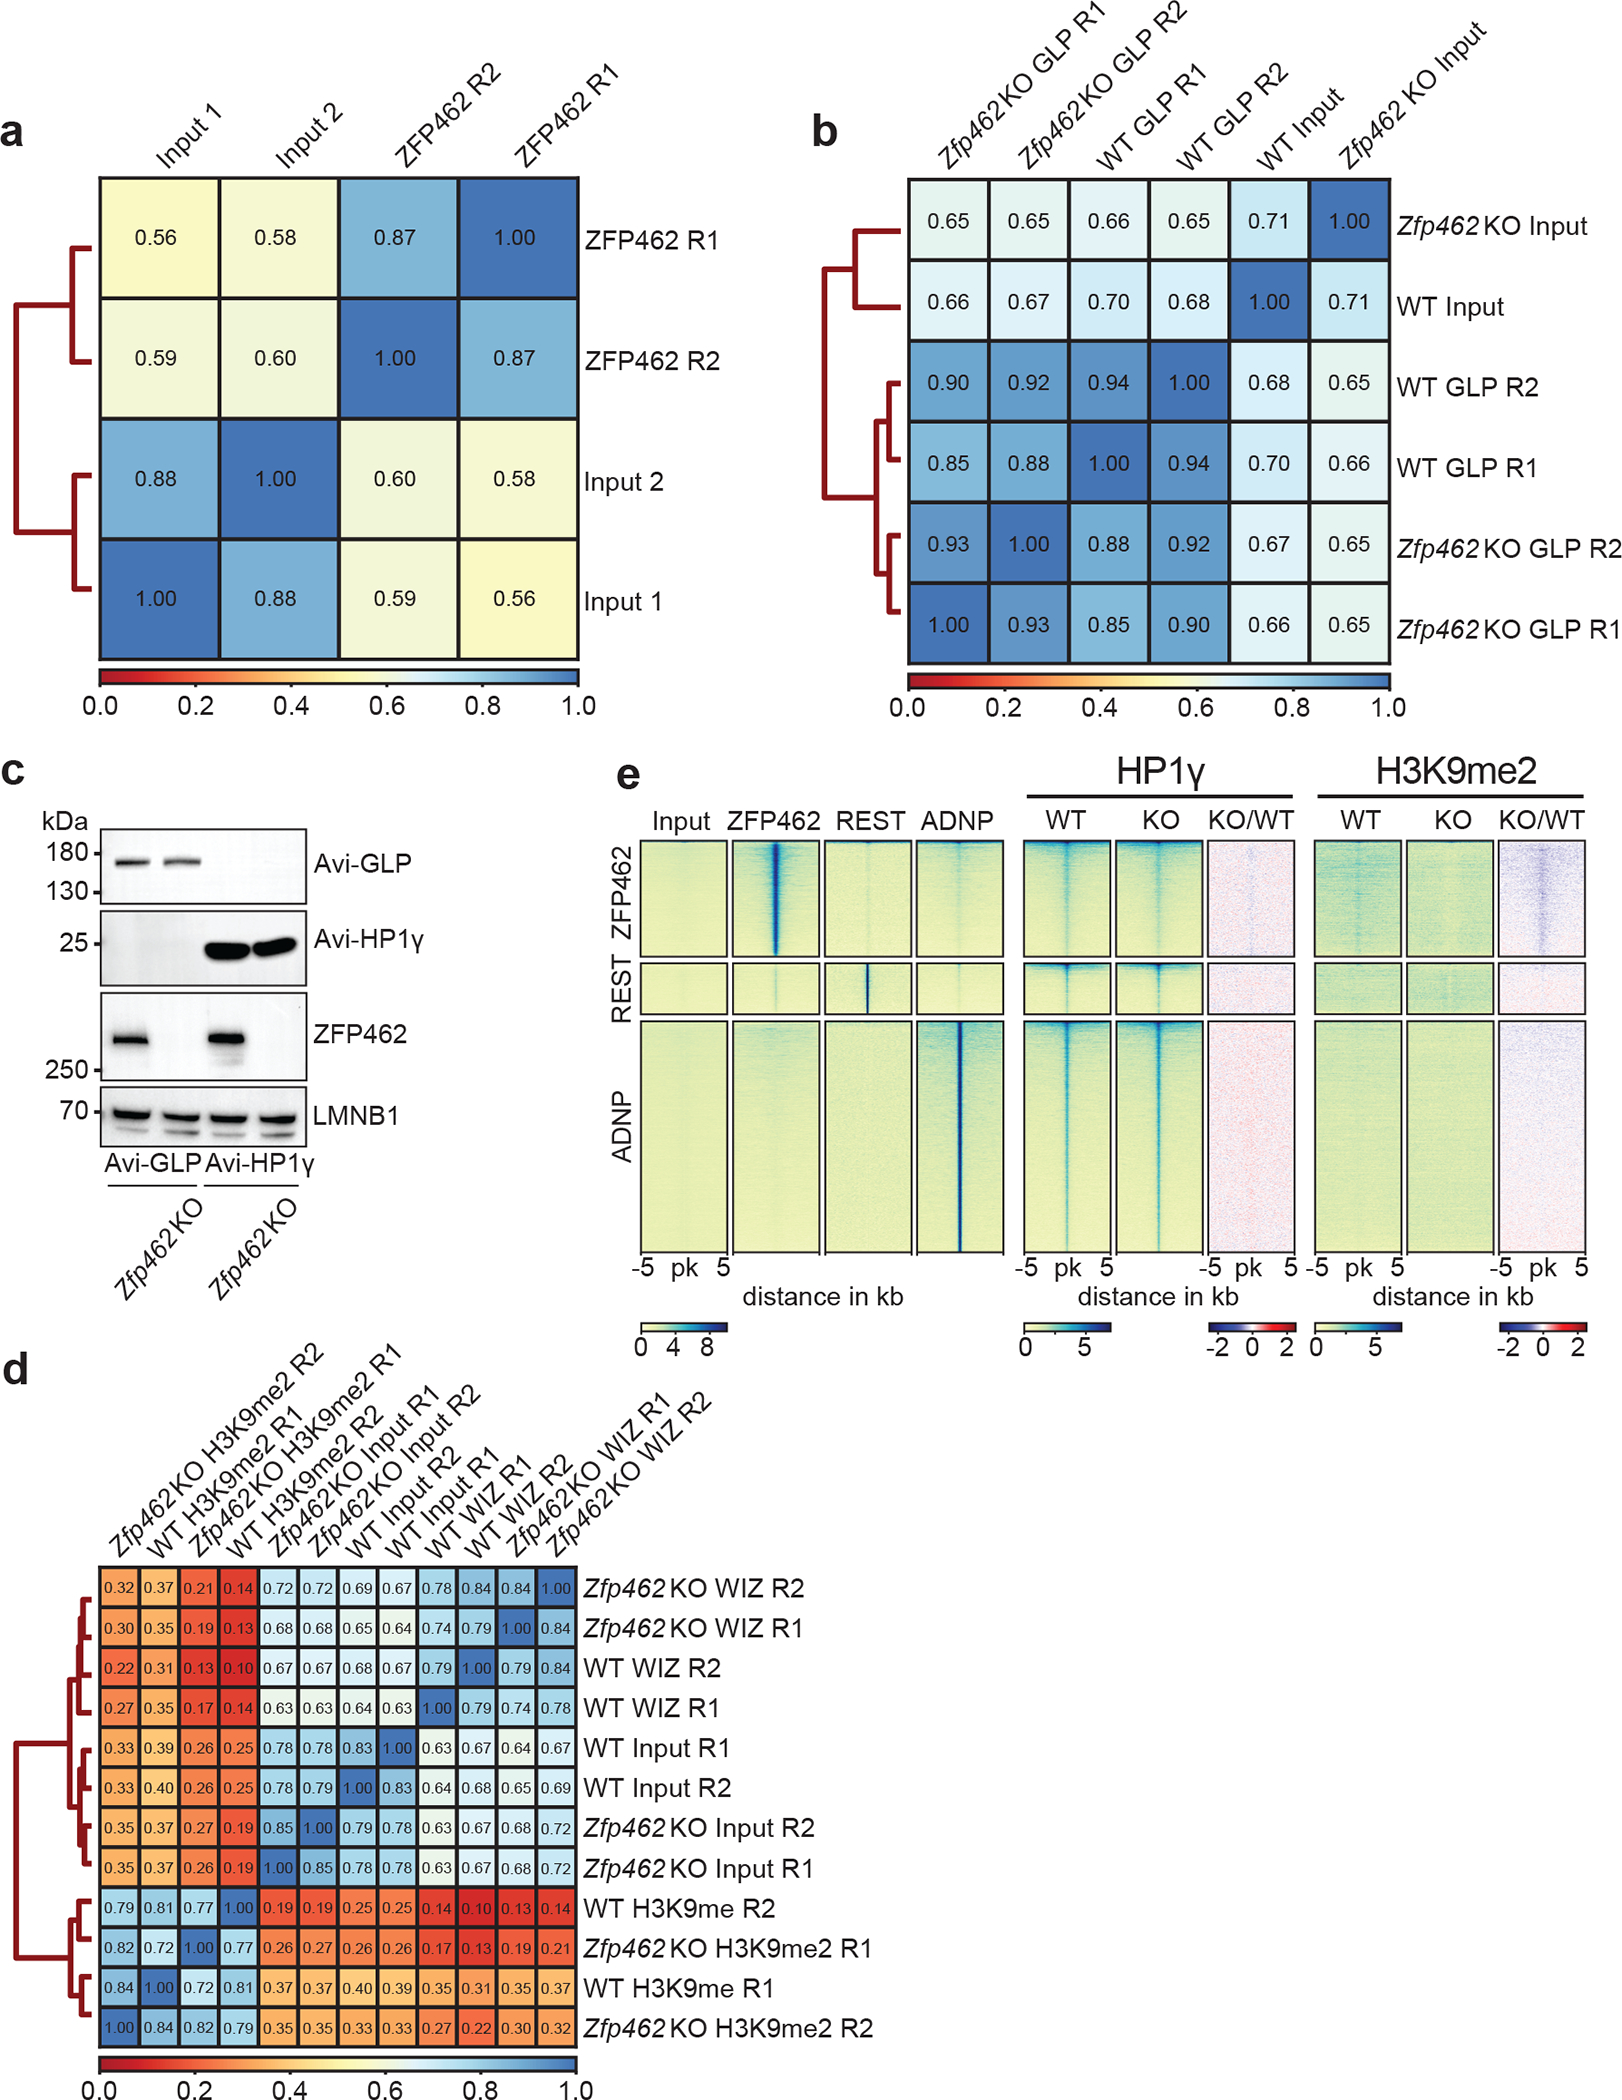
Extended Data Fig. 5: ChIP-seq profiles of ZFP462, REST, ADNP, HP1γ and H3K9me2 in WT and Zfp462 KO ESCs.

a) Heatmap shows Spearman correlation between input controls and two independent ZFP462 ChIP-seq experiments. b) Heatmap shows Spearman correlation between input controls and two independent ChIP-seq experiments of GLP and HP1γ in WT and Zfp462 KO ESCs. c) Western blot shows ZFP462 expression in WT and Zfp462 KO Avi-FLAG-tagged GLP and HP1γ ESCs. d) Heatmap shows Spearman correlation between input controls and two independent ChIP-seq experiments of WIZ and H3K9me2 in WT and Zfp462 KO ESCs. e) Heatmaps of ZFP462, REST, ADNP, HP1γ and H3K9me2 ChIP-seq signals at ZFP462, REST and ADNP peaks in WT and Zfp462 KO ESCs. Blue-to-red scaled heatmap represents ChIP-seq enrichment ratios between Zfp462 KO versus WT (KO/WT). Each heatmap represents a 10 kb window centred on peak midpoints, sorted by ZFP462, REST and ADNP signal in their respective clusters. Below are scale bars (n = average distribution of two replicates).
