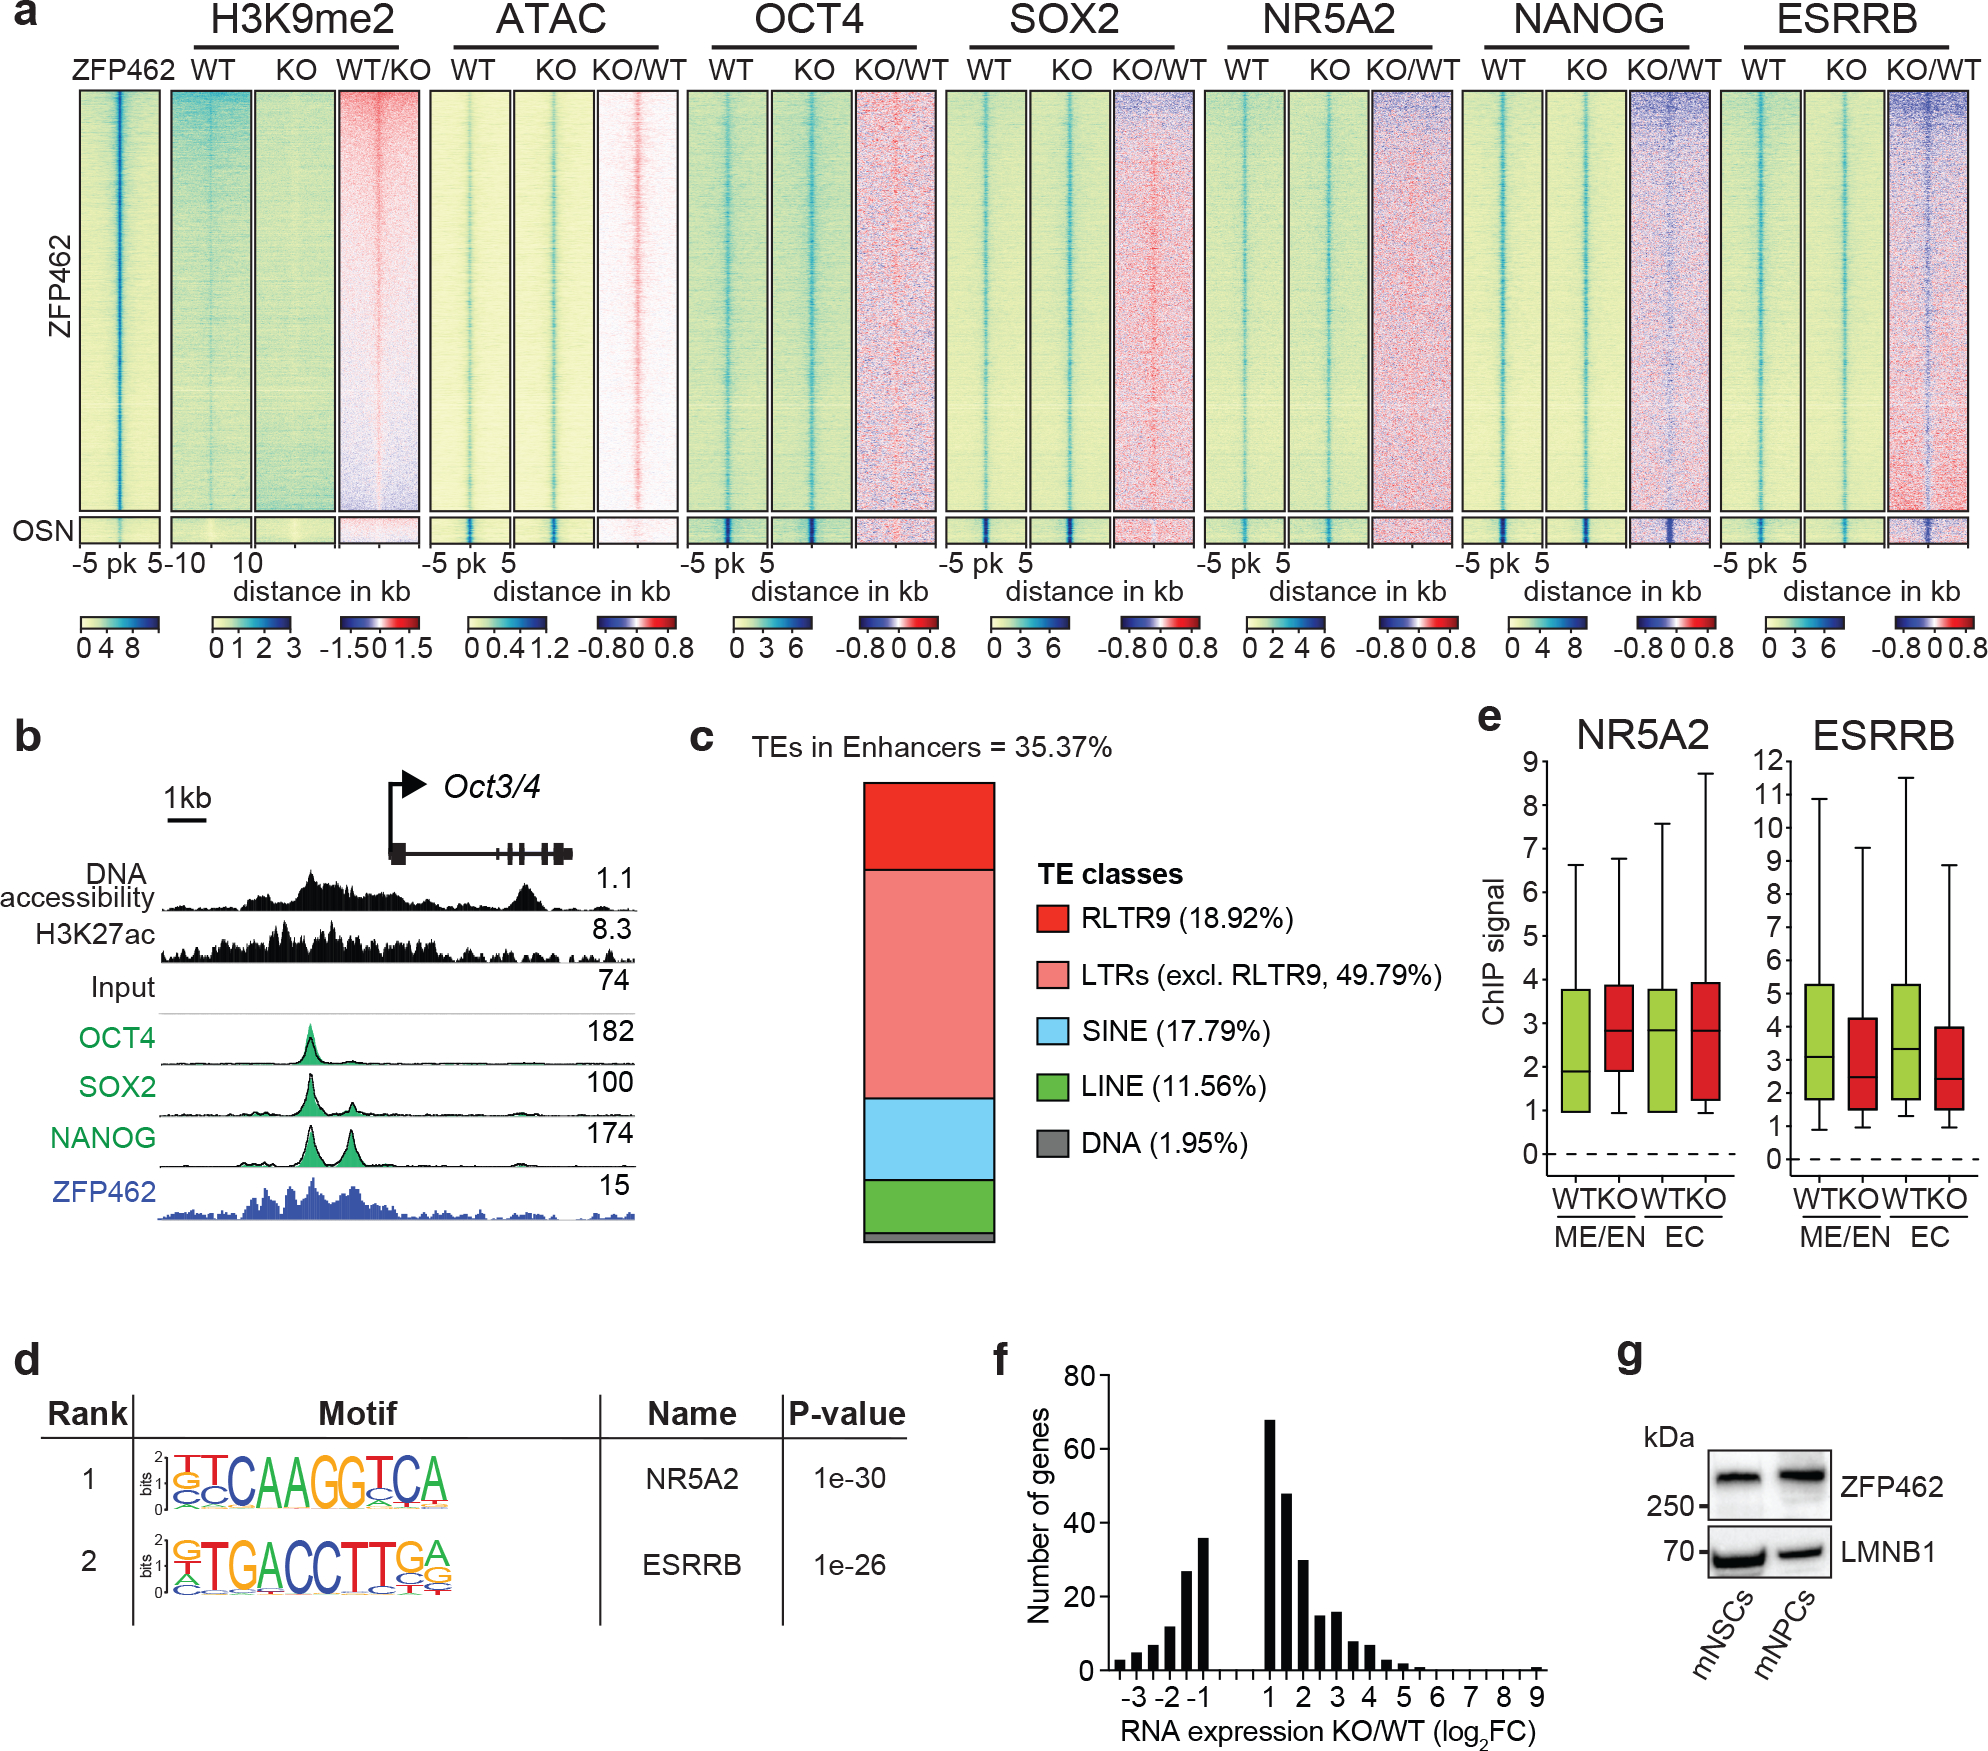
Extended Data Fig. 7. Correlation between genomic distribution of ZFP462 and pluripotency transcription factors.

a) Heatmaps show ATAC-seq and ChIP-seq signal of ZFP462, H3K9me2, OCT4, SOX2, NANOG, ESRRB and NR5A2 at peaks of ZFP462, OSN (shared OCT4-SOX2-NANOG peaks not overlapping with ZFP462 peaks) and REST. Red-to-blue scaled heatmaps represent signal ratios between Zfp462 KO versus WT (KO/WT). Each row represents a 10 kb window centred on peak midpoints, sorted by H3K9me2 KO/WT ChIP signal loss. (n = average distribution of two ChIP-seq replicates / ATAC-seq three replicates). b) Genomic screenshot shows DNA accessibility (ATAC-seq) and ChIP-seq signals of H3K27ac and ZFP462 at the Oct3/4 locus in WT ESCs. ChIP-seq signals of OCT4, SOX2 and NANOG in WT (black line) and Zfp462 KO ESCs (green fill) are superimposed. ATAC-seq and ChIP-seq profiles are normalized to library size. c) Bar plot shows percentage of ZFP462-bound TE families overlapping with ChromHMM-annotated enhancers in ESCs. ZFP462-bound TEs contribute a total of 35.37% of ChromHMM-annotated enhancers in ESCs. d) HOMER analysis of known DNA sequence motifs enriched at ZFP462 peaks overlapping ChromHMM-annotated ME/EN-specific enhancers. Top ranked DNA sequence motifs and respective significance values are shown in the table. e) Box plots shows enrichment of NR5A2 and ESRRB ChIP signal in WT and Zfp462 KO ESCs at ZFP462 peaks overlapping with Mesoderm (ME)/Endoderm (EN)- and Ectoderm (EC)-specific enhancers. n = 553 (EN/ME), n = 314 (EC). Shown are median (horizontal line), 25th to 75th percentiles (boxes), and 90% (whiskers). Outliers are excluded. f) Bar plot shows frequency distribution of significantly up- and down-regulated genes located proximal to ZFP462 peaks annotated as ME/EN-specific enhancers (KO/WT, LFC ≥ 1 and padj. ≤ 0.05). g) Western blot shows ZFP462 protein expression in NSCs isolated from mouse brain and NPCs differentiated from WT ESCs. LMNB1 is used as loading control.
