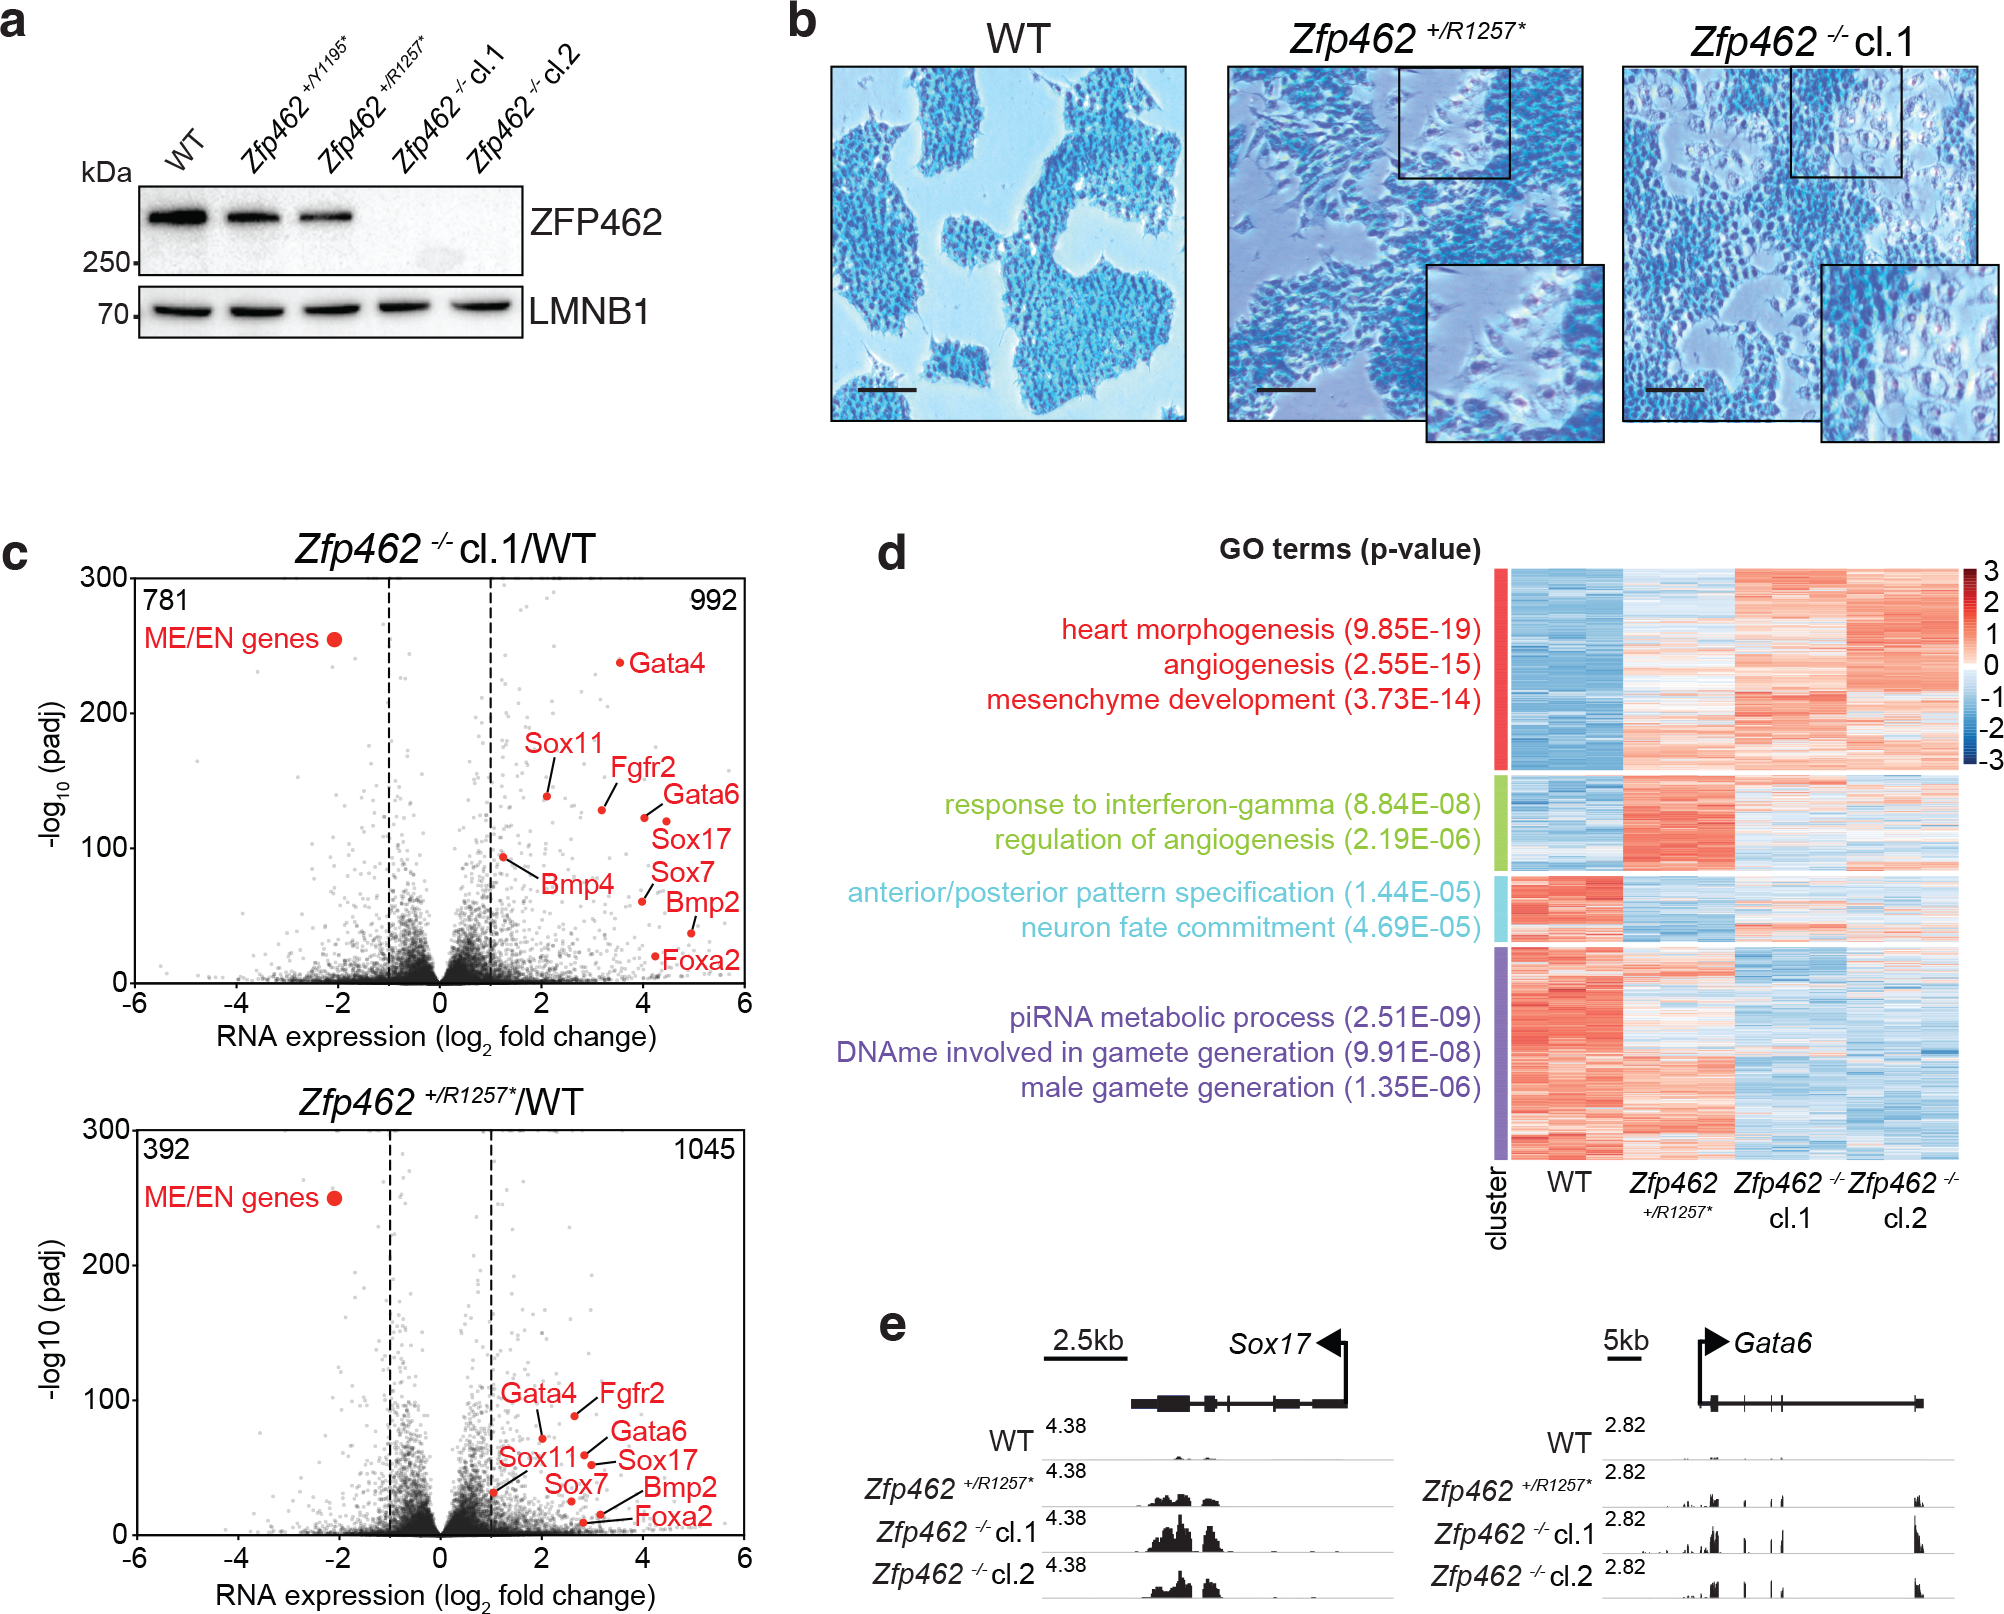
Fig. 3: Depletion of Zfp462 leads to aberrant expression of lineage specifying genes.

a) Western blot shows ZFP462 protein expression in wild-type (WT), two heterozygous and two homozygous Zfp462 mutant ESC lines. LMNB1 serves as loading control and reference for relative ZFP462 quantification (numbers below). b) Alkaline phosphatase staining of WT, heterozygous and homozygous Zfp462 mutant ESCs. Enlarged region is marked as square in the image. Scale bar = 100μm. c) Volcano plots show gene expression changes in homozygous (top) and heterozygous (bottom) Zfp462 mutant ESCs compared to WT ESCs (n = three replicates). Indicated are the numbers of significantly up- or down regulated genes. (padj. ≤ 0.05; LFC ≥ 0.5). d) Heatmap show cluster analysis of differentially expressed genes (padj. ≤ 0.05; LFC ≥ 1) in WT and Zfp462 mutant ESCs. Top gene ontology (GO) terms and corresponding significance are indicated for each cluster (left). e) Genomic screen shots of Sox17 and Gata6 show mRNA expression levels in WT and Zfp462 mutant ESCs. All RNA-seq profiles are normalized for library size.
