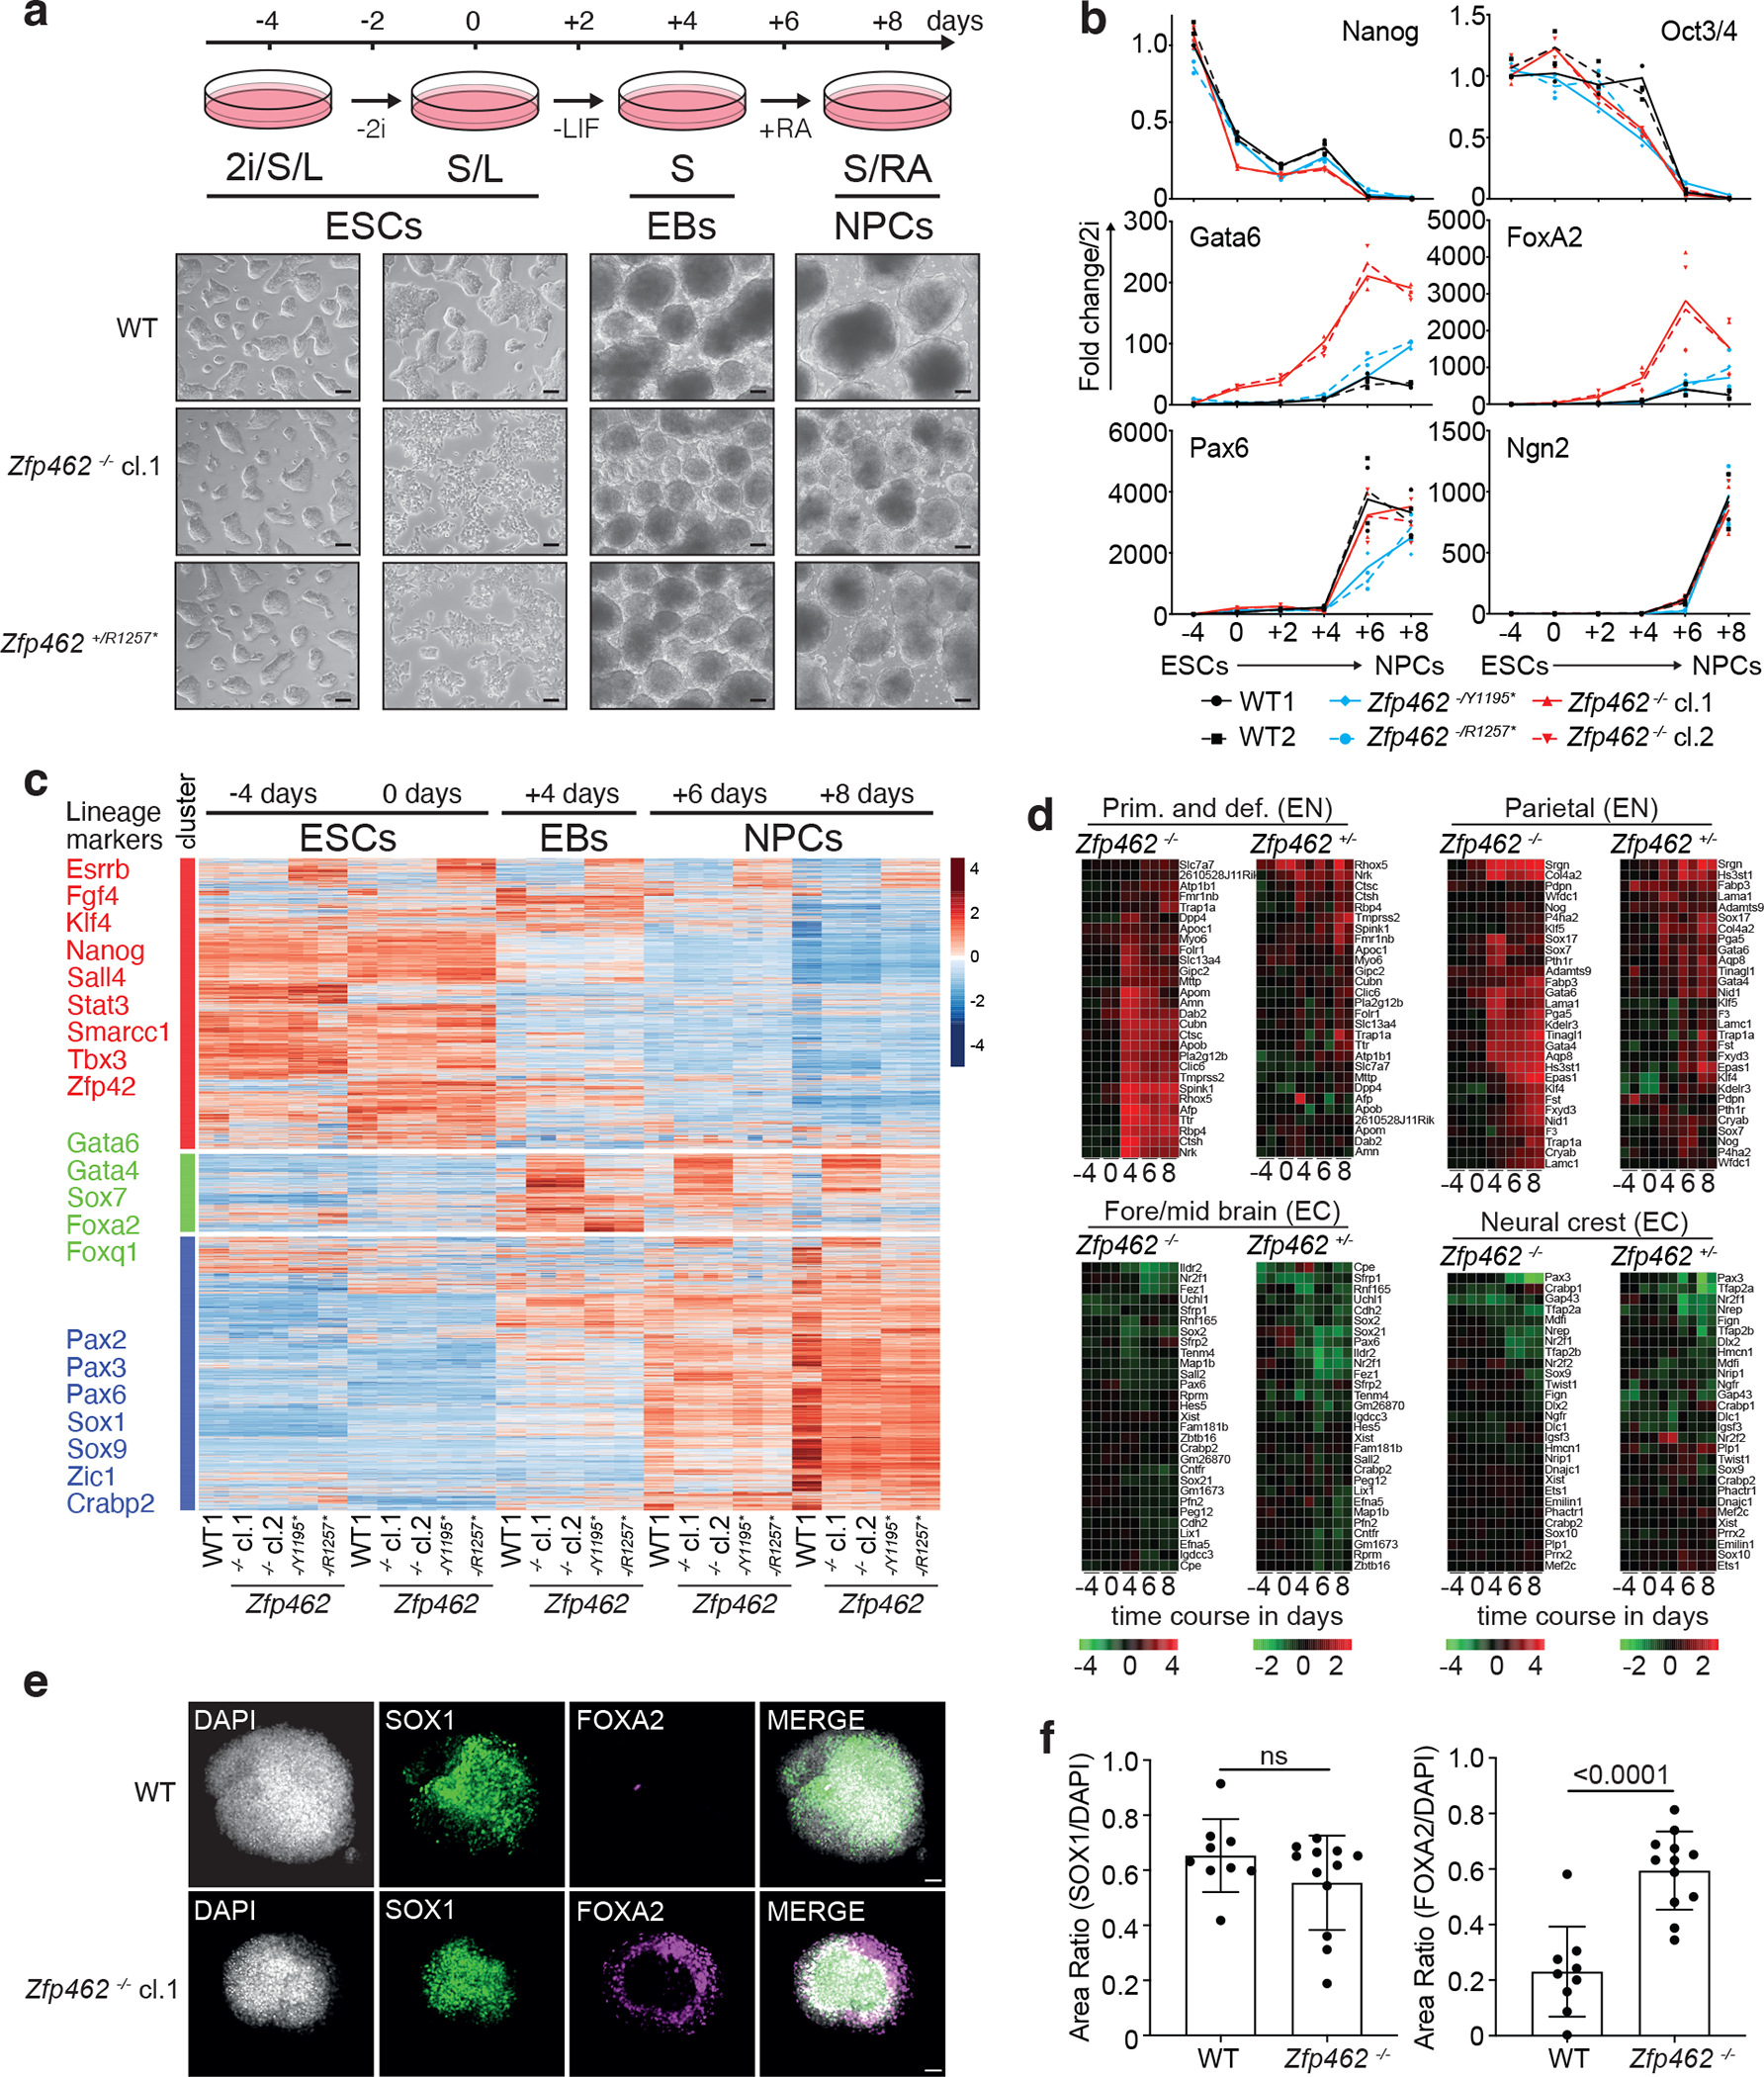
Fig. 4: Zfp462 mutant cells show abnormal cell fate specification during neuronal differentiation.

a) Scheme shows design of neural differentiation experiment from ESCs to neural progenitor cells (NPCs) (top). Stepwise withdrawal of 2i inhibitors (2i) and Leukaemia Inhibitory Factor (LIF) leads to formation of cellular aggregates called embryoid bodies (EBs). Subsequent treatment with retinoic acid (RA) induces enrichment of NPCs. Representative bright field images show WT and Zfp462 mutant cells at corresponding stages of neural differentiation. Scale bar = 100μm. b) Line plots shows RT-qPCR analysis of lineage marker expression during neural differentiation (n=two replicates). Expression levels are shown relative to ESCs (2i/S/L). c) Heatmap shows cluster analysis of differentially expressed genes (padj. ≤ 0.05; LFC ≥ 1) in WT and Zfp462 mutant cells during neural differentiation (n = two replicates). Selected lineage marker genes are indicated for each cluster (left). d) Heatmaps show differential expression of selected marker genes specific for endodermal and neural lineages in heterozygous and homozygous Zfp462 mutant cells during neural differentiation. e) Immunohistochemistry analysis shows SOX1 and FOXA2 expression in WT and homozygous Zfp462 mutant at day 8 of neural differentiation. Cell aggregates are counterstained with DAPI. Scale bar = 50μm. f) Bar plots show quantification of SOX1 and FOXA2 immunofluorescence in WT (n = 9 cell aggregates over 2 independent experiments) and Zfp462 −/− cell (n = 12 cell aggregates over 3 independent experiments). Data are presented as mean values +/− SD. P values derived from a two-tailed t-test are indicated.
