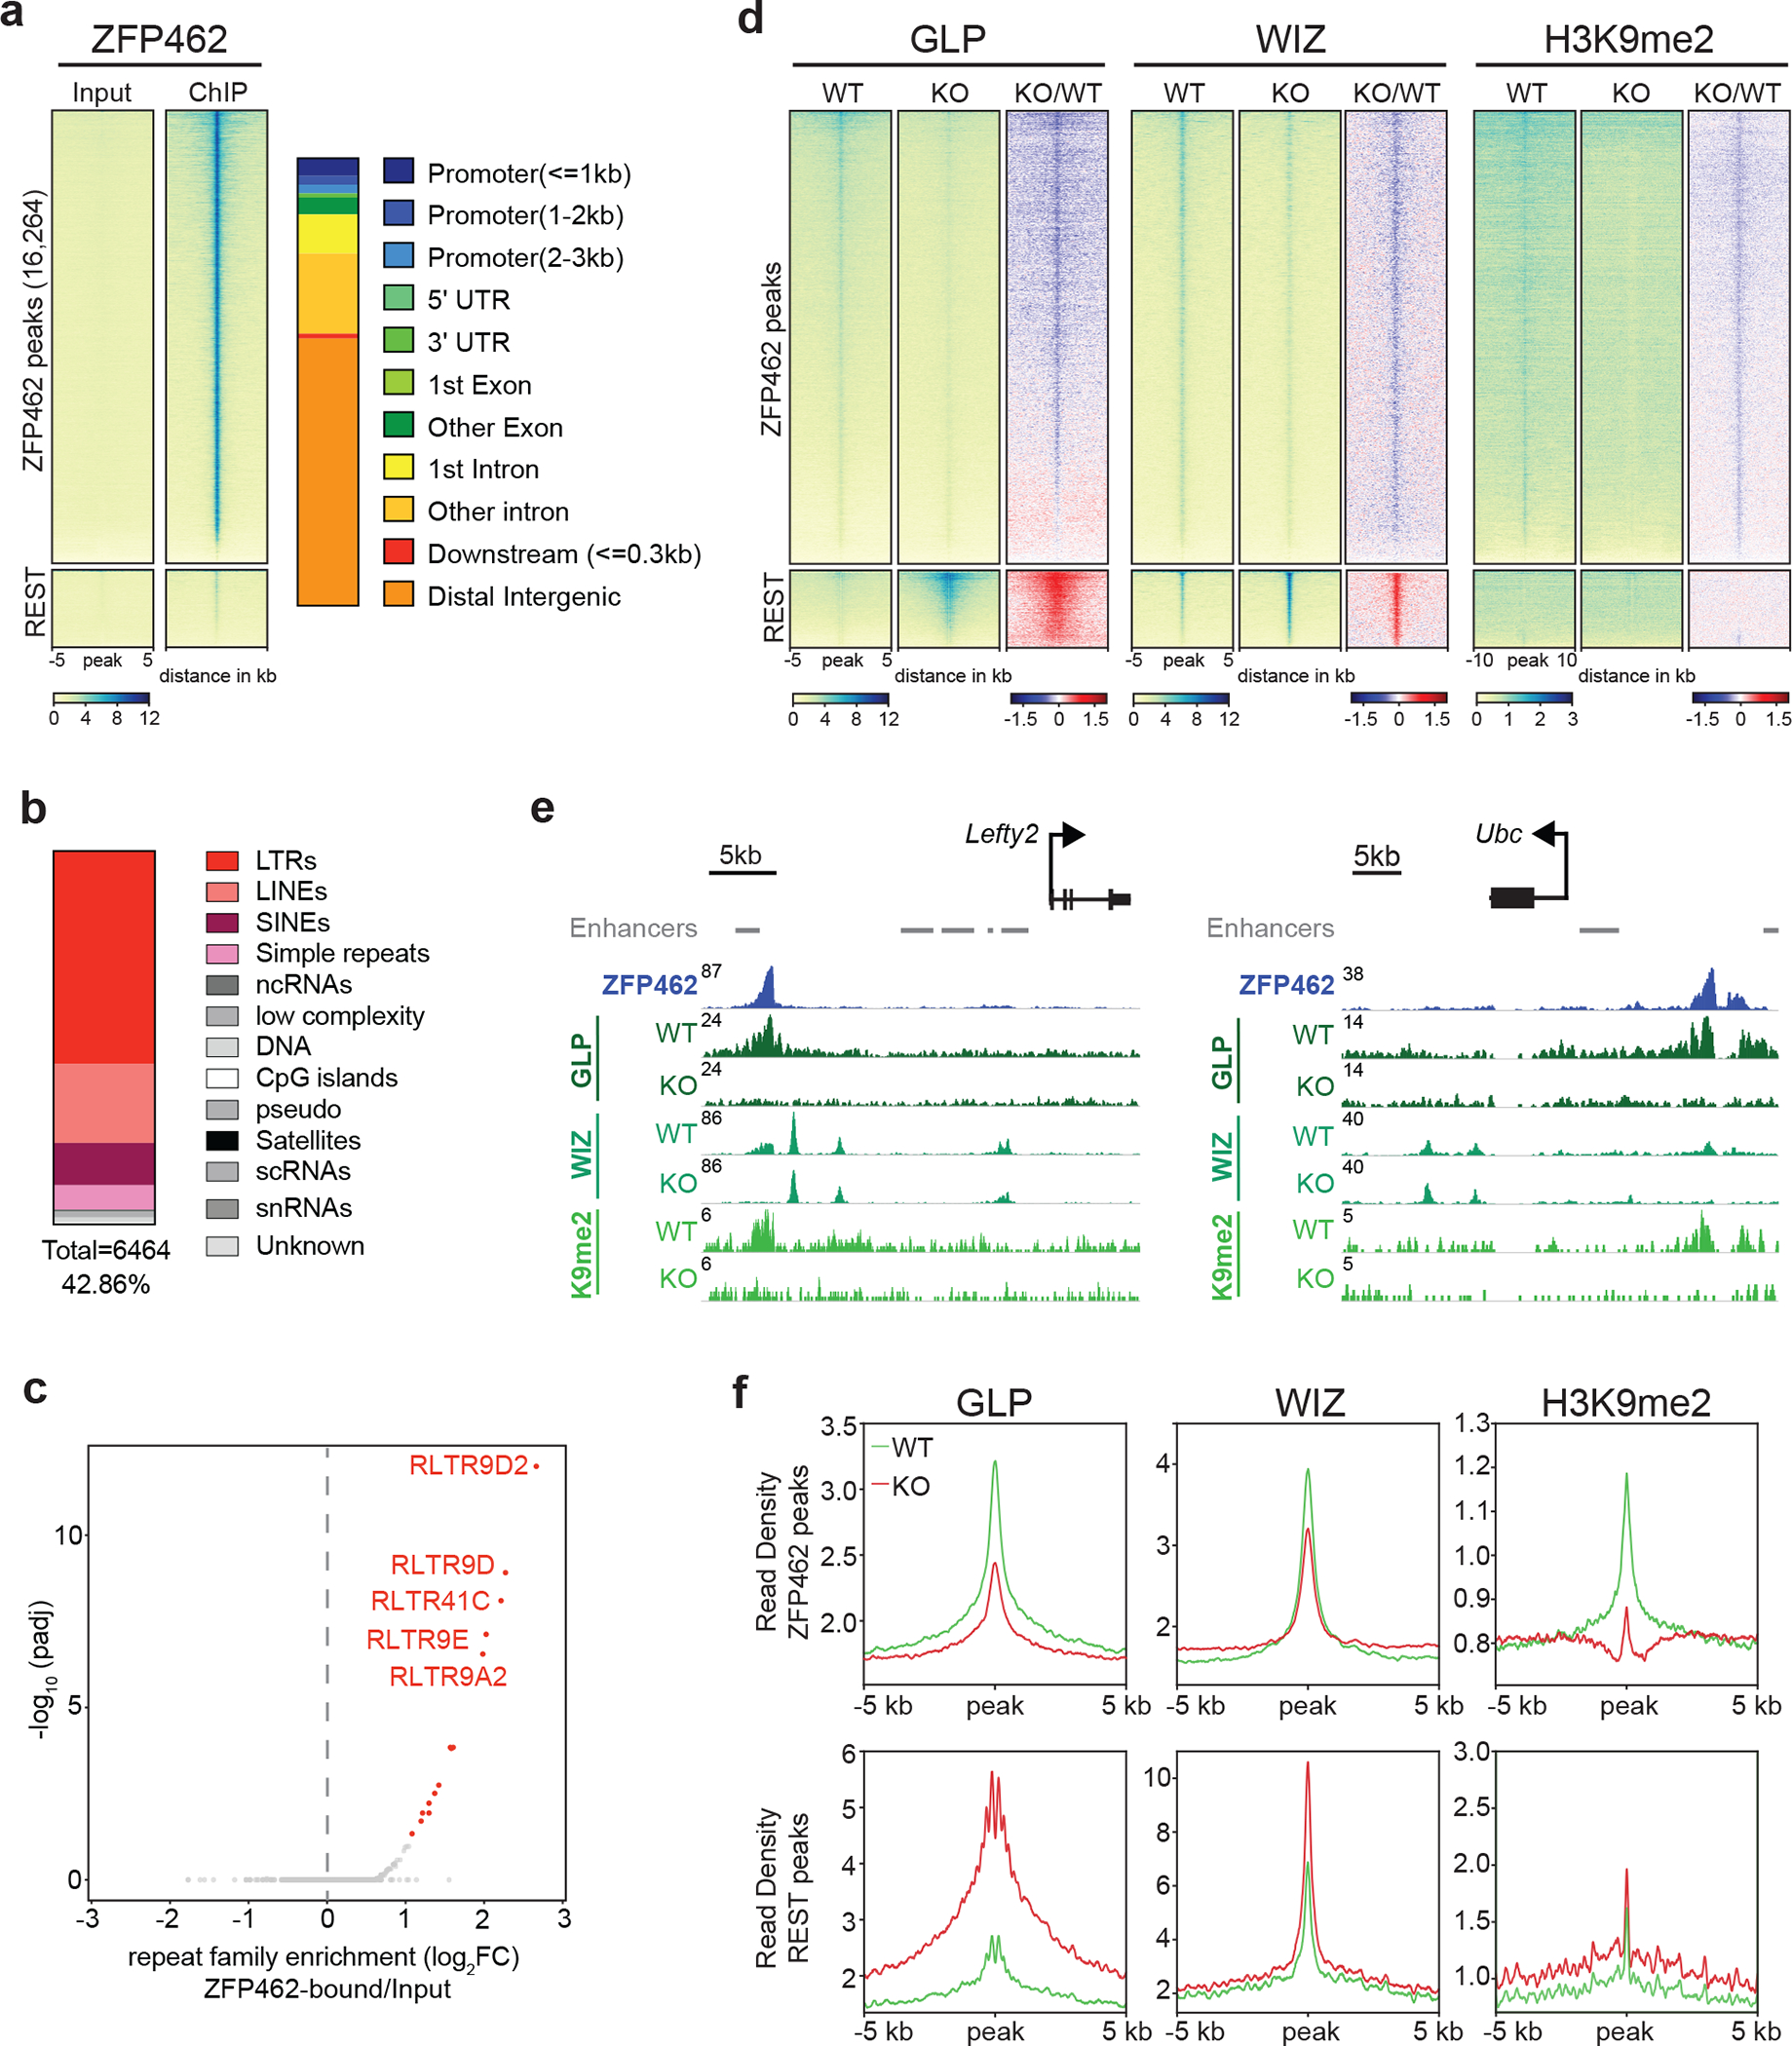
Fig. 5: ZFP462 establishes H3K9me2 containing heterochromatin by recruiting GLP and WIZ proteins.

a) Heatmaps of ZFP462 ChIP-seq enrichment at significant ZFP462 peaks (16,264) (top cluster) and REST peaks (bottom cluster) in ESCs. Each row represents a 10 kb window centred on peak midpoint, sorted by ZFP462 ChIP signal. Input signals for the same windows are shown on the left. Below are scale bars. (n = average distribution of two replicates). Bar plot, on the right, shows percentage of genomic features overlapping with ZFP462 peaks. b) Bar plot shows fraction of repetitive DNA types overlapping with ZFP462 peaks. 39.76 % of ZFP462 peaks are associated with repeat elements. c) Volcano plot shows enrichment and corresponding significance of TE families overlapping with ZFP462 peaks. d) Heatmaps of GLP, WIZ and H3K9me2 ChIP-seq enrichment at ZFP462 and REST peaks in WT and Zfp462 KO ESCs. Blue-to-red scaled heatmap represents corresponding ChIP-seq enrichment ratio between Zfp462 KO versus WT (KO/WT). All heat maps are sorted by GLP enrichment signal in WT. For GLP and WIZ, each row represents a 10 kb window centred on ZFP462 peak midpoints. For H3K9me2, each row represents a 20 kb window (n = average distribution of two replicates). e) Screen shots of two selected genomic regions with ZFP462 peaks display GLP, WIZ and H3K9me2 ChIP-seq signals in WT and Zfp462 KO ESCs. Grey bars indicate ENCODE enhancer annotations. ChIP-seq profiles are normalized for library size. f) Metaplots show average GLP, WIZ and H3K9me2 signal at ZFP462 and REST peaks in WT and Zfp462 KO ESCs. For each plot, read density is plotted at 10 kb window centred on peak midpoints.
