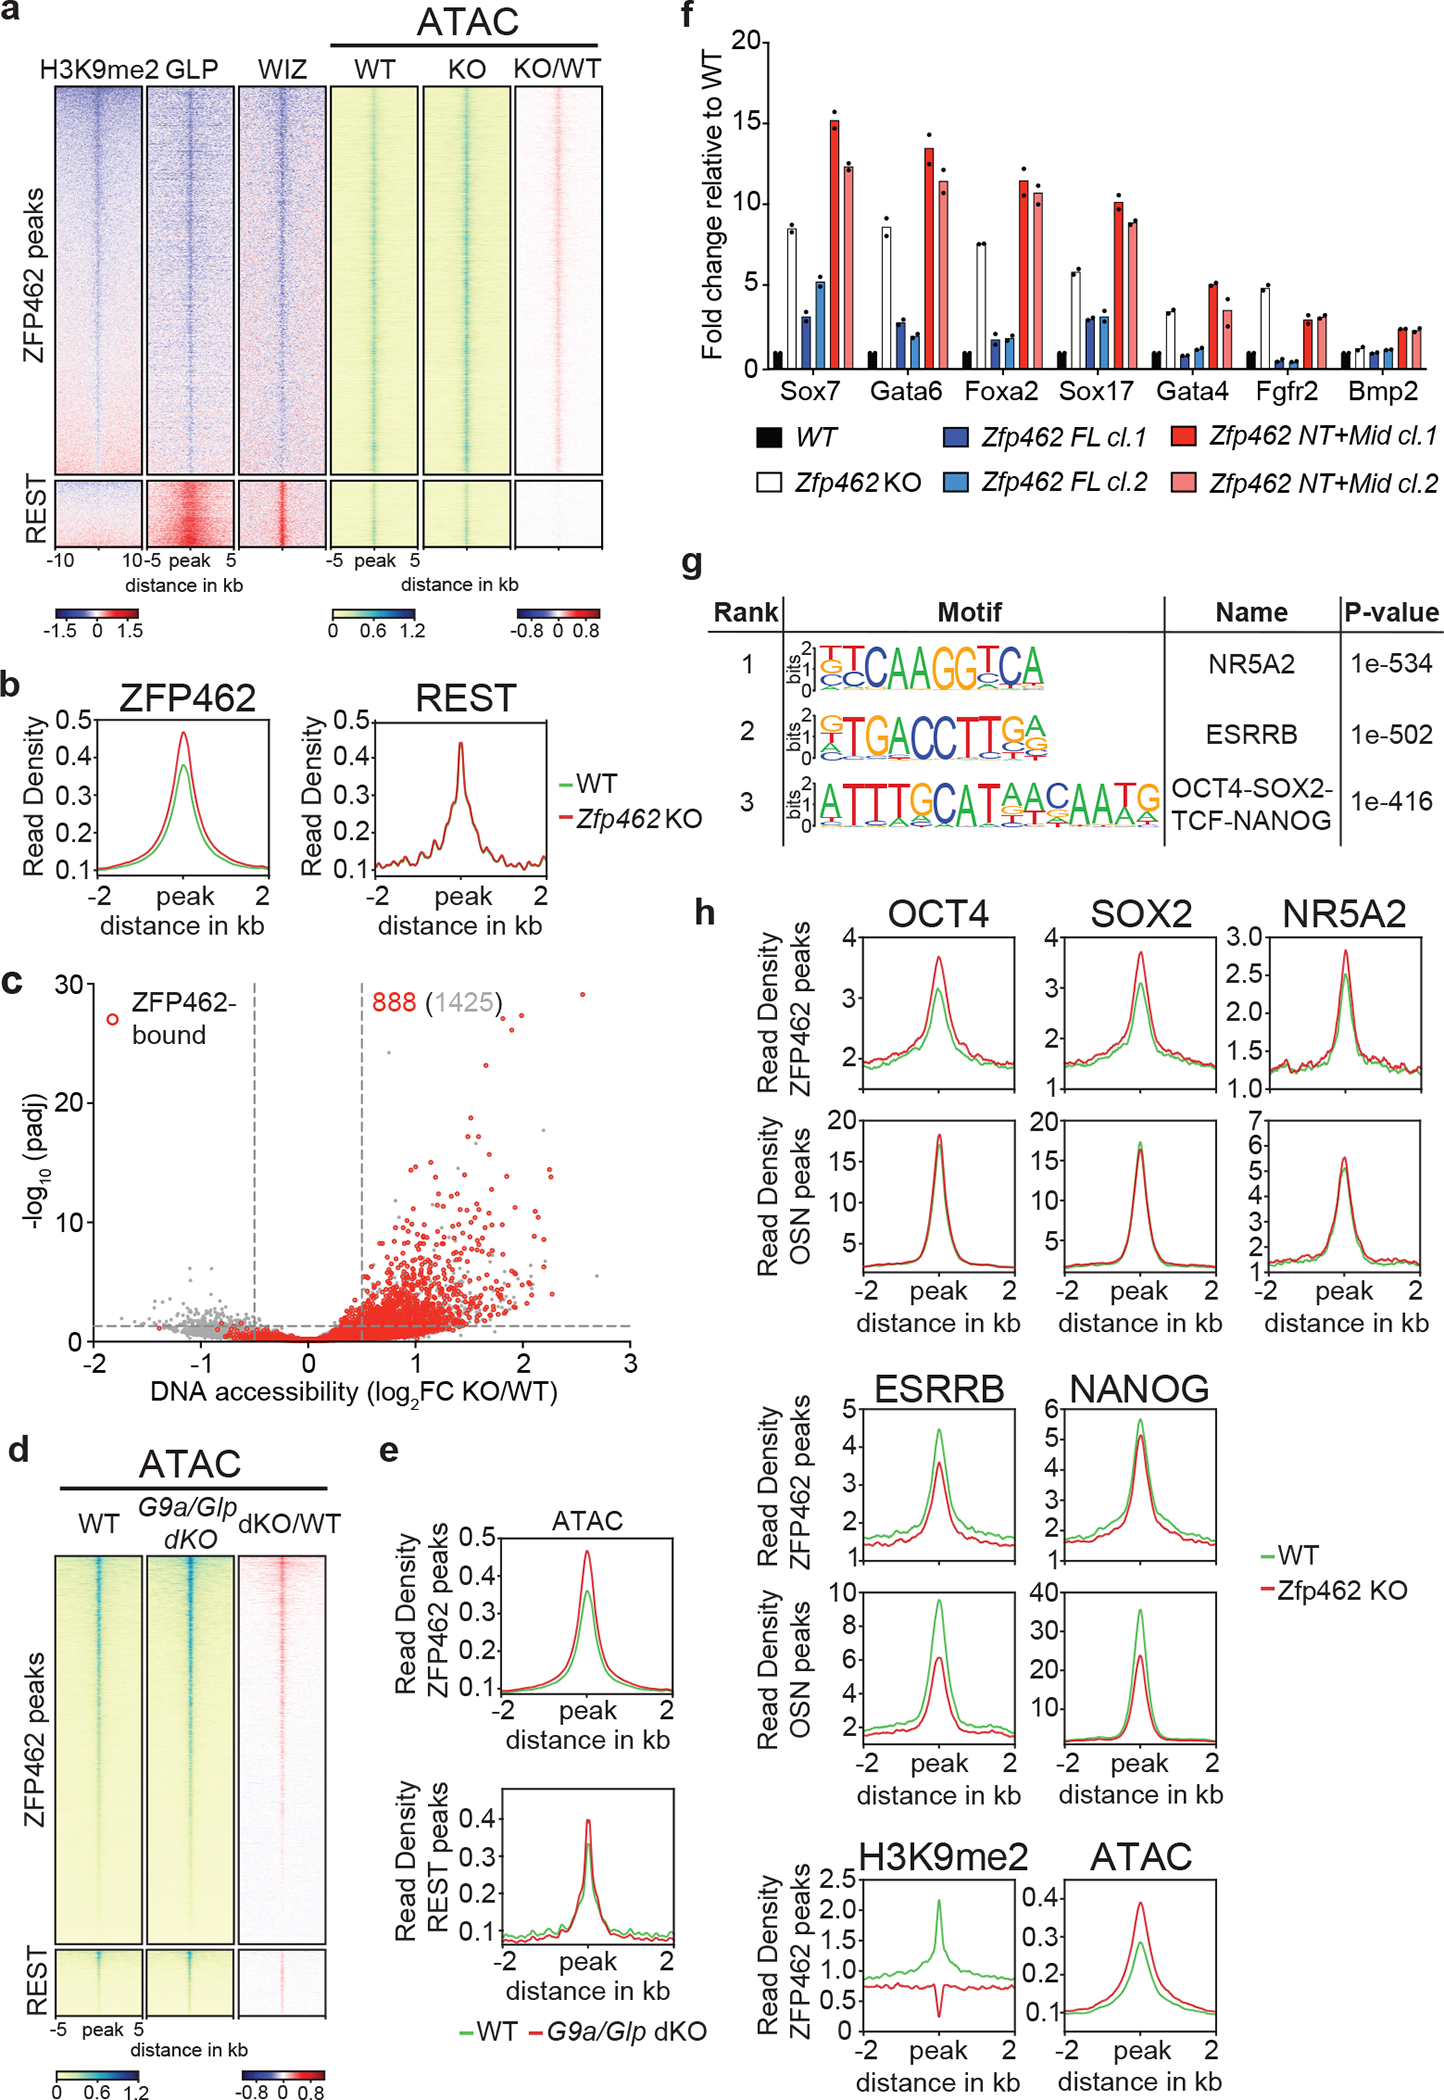
Fig. 6: ZFP462 targeted heterochromatin restricts DNA accessibility and TF binding.

a) Heatmaps of GLP, WIZ and H3K9me2 ChIP-seq enrichment ratios between Zfp462 KO versus WT (KO/WT) ESCs at ZFP462 and REST peaks. On the right, heatmaps of ATAC-seq signal at ZFP462 and REST peaks in WT and Zfp462 KO ESCs. Blue-to-red scaled heatmap represent corresponding enrichment ratios between Zfp462 KO versus WT (KO/WT) ESCs. GLP, WIZ and ATAC-seq heatmaps represent a 10kb window, H3K9me2 heatmap represent a 20 kb window centred on peak midpoints, sorted by H3K9me2 KO/WT enrichment ratio (n = average distribution of two ChIP-seq replicates and average distribution of three ATAC-seq replicates). b) Metaplots show average profiles of ATAC-seq signal in WT (green) and Zfp462 KO (red) ESCs at ZFP462 peaks (left) and REST peaks (right). c) Volcano plot shows DNA accessibility changes between WT and Zfp462 KO ESCs. X-axis represents fold change in accessibility and corresponding significance on Y-axis. Differentially accessible sites bound by ZFP462 are highlighted in red. Indicated in grey is the number of loci with increased DNA accessibility and in red the number of ZFP462-bound loci with increased DNA accessibility with significance < 0.05. d) Heatmaps of ATAC-seq signal at ZFP462 and REST peaks in WT and G9a/Glp dKO ESCs. Blue-to-red scaled heatmap represent corresponding enrichment ratios between G9a/Glp dKO versus WT (KO/WT) ESCs. Each row represents a 10 kb window centred on peak midpoints, sorted by dKO/WT enrichment ratio (n = average distribution of two ATAC-seq replicates). e) Metaplots show average profiles of ATAC-seq signal in WT (green) and G9a/Glp dKO (red) ESCs at ZFP462 peaks (above) and REST peaks (below). f) RT-qPCR expression analysis of meso-endodermal marker genes in WT, Zfp462 KO and Zfp462 KO ESCs expressing ZFP462 FL or ZFP462 NT+Mid. n = 2 independent biological replicates. g) HOMER analysis of known DNA sequence motifs enriched at significant ZFP462 peaks. Top ranked DNA sequence motifs and respective significance values are shown in the table. h) Metaplots show average pluripotency TF ChIP-seq signal in WT and Zfp462 KO ESCs at ZFP462 peaks with LFC ≥ 1 in KO/WT H3K9me2 ChIP signal loss and at shared OCT4-SOX2-NANOG (OSN) peaks that are not bound by ZFP462. (n = average distribution of two replicates).
