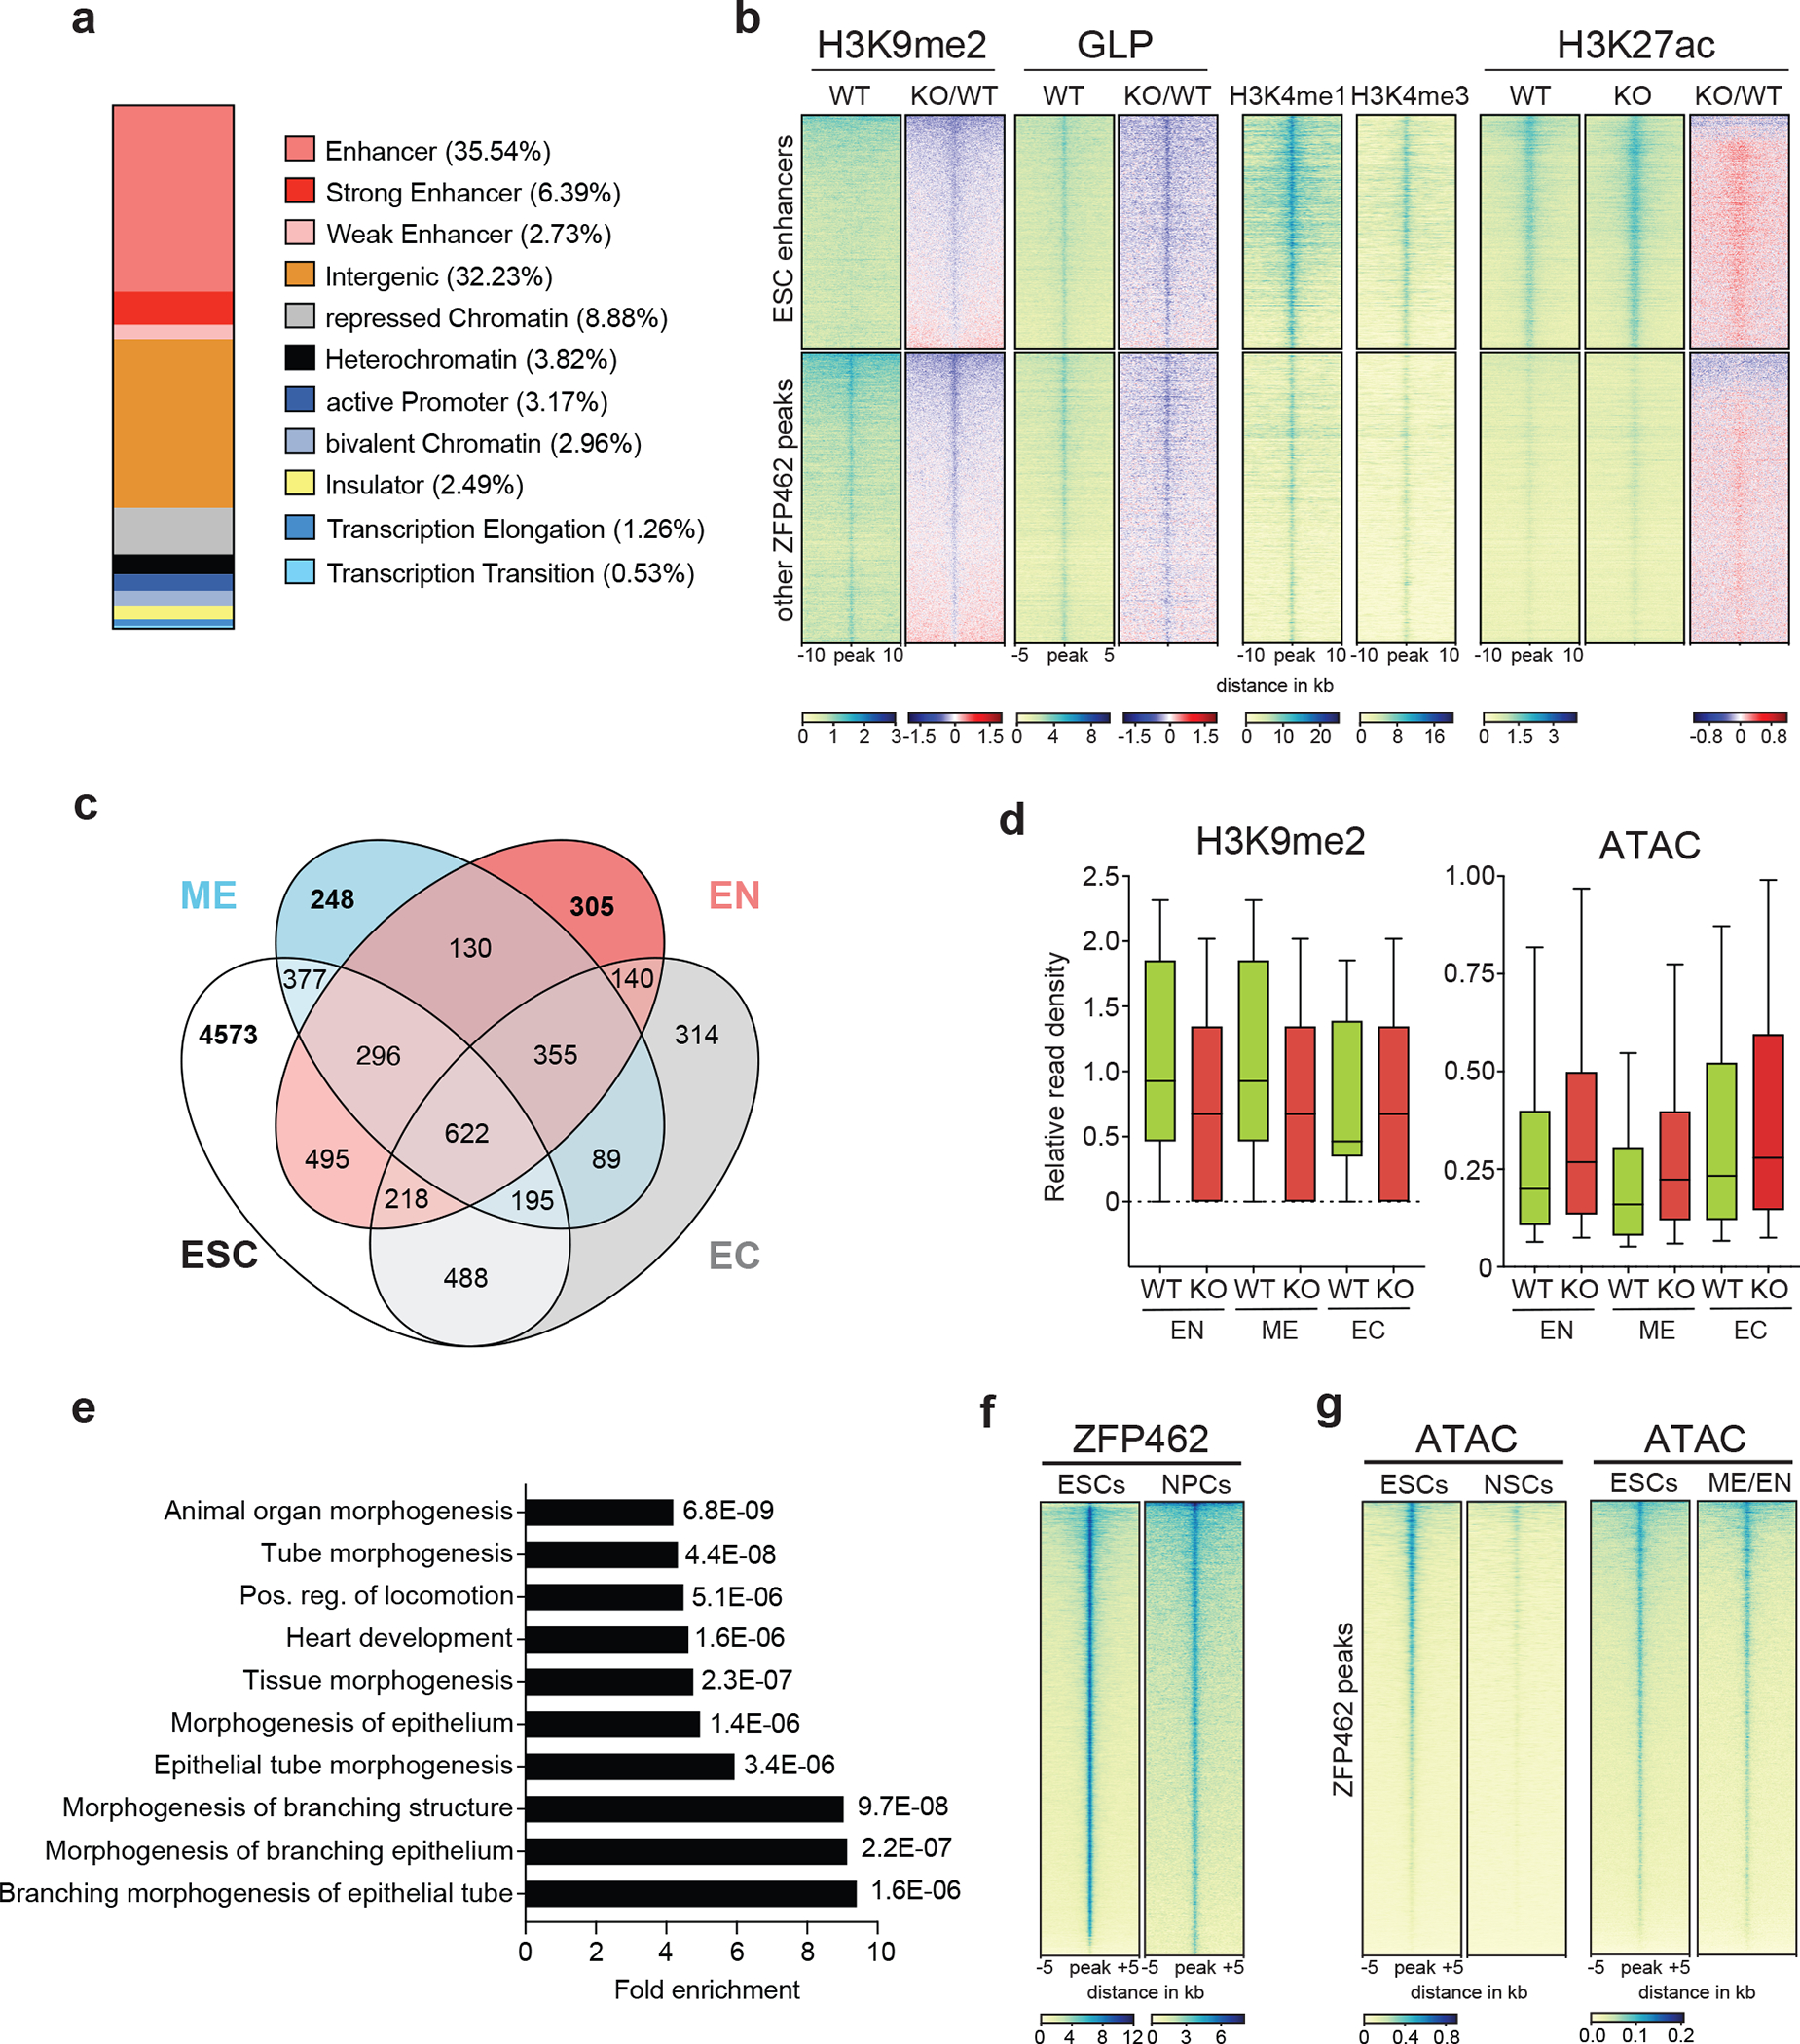
Fig. 7: ZFP462 represses meso-endodermal enhancers in ESCs.

a) Bar plot shows percentage of ZFP462 ChIP-seq peaks overlapping with ChromHMM states in ESCs. b) Heatmaps of GLP, H3K9me2, H3K4me1, H3K4me3 and H3K27ac ChIP-seq signals at ZFP462 peaks separated into two clusters: ESC enhancers and other ZFP462 peaks. Blue-to-red scaled heatmap represent corresponding enrichment ratios between Zfp462 KO versus WT (KO/WT). GLP heatmap represent 10kb and histone modifications heatmaps represent a 20 kb window centred on peak midpoints, sorted by H3K9me2 KO/WT enrichment ratio (n = average distribution of two ChIP-seq replicates). c) Venn diagram shows overlap of ZFP462 peaks with ChromHMM-annotated enhancers in ESC, Endoderm (EN), Mesoderm (ME) and Ectoderm (EC). d) Box plots shows enrichment of H3K9me2 ChIP signal and ATAC-seq signal in WT and Zfp462 KO ESCs at ZFP462 peaks overlapping with Endoderm (EN)-, Mesoderm (ME)- and Ectoderm (EC)-specific enhancers. n = 305 (EN), n = 248 (ME), n = 314 (EC). Shown are median (horizontal line), 25th to 75th percentiles (boxes), and 90% (whiskers). Outliers are excluded. e) Bar plot shows GO term analysis of biological processes of genes with significant differential expression (KO/WT, LFC ≥ 1 and padj. ≤ 0.05) located proximal to ZFP462 peaks annotated as meso-endoderm-specific enhancers77. f) Heatmap of ZFP462 ChIP-seq enrichment at ZFP462 peaks in ESCs and NPCs. ChIP-seq rows represent 10 kb window centred on ZFP462 peak midpoints, sorted by ZFP462 ChIP-seq signal intensity (n = average distribution of two replicates). g) Heatmaps of ATAC-seq signal at ZFP462 peaks in ESCs and NSCs (left). Heatmaps of ATAC-seq signal at ZFP462 peaks in ESCs and meso-endoderm (ME/EN) cells 66. ATAC-seq rows represent 10 kb window centred on ZFP462 peak midpoints, sorted by ESCs ATAC-seq signal intensity.
