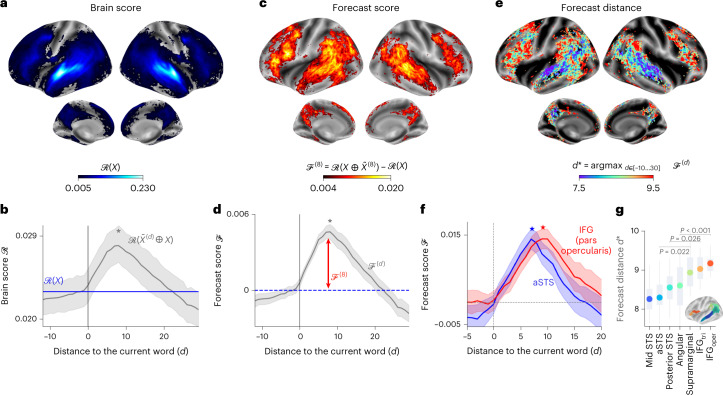
Fig. 2. Isolating language predictions and their temporal scope in the human brain.
a, The ‘brain score’ (; Fig. 1b and Methods), obtained with GPT-2, for each individual and each voxel, here averaged across individuals (n = 304). Only the voxels with significant brain scores are colour-coded. b, Average (across voxels) brain scores obtained with GPT-2 with (grey) or without (blue) forecast representations. The average brain score peaks at d* = 8 (grey star). c, For each voxel, the average (across individuals) ‘forecast score’ , that is, the gain in brain score when concatenating the activations of GPT-2 with a forecast window is shown. Only the voxels with significant forecast scores are colour-coded. d, Average (across voxels) forecast scores for different distance d. e, Distance that maximizes , computed for each individual and each voxel and denoted d*. This ‘forecast distance’ reveals the regions associated with short- and long-range forecasts. Regions in red and blue are associated with long-range and short-range forecasts, respectively. We only display the voxels with a significant average peak (; Methods). f, Forecast score within two regions of interest. For each region, we report the average forecast scores of individuals with a representative peak (individuals whose peak belongs to the 45–55 percentiles of all peaks, n = 30 individuals). g, Forecast distance of seven regions of interest, computed for each voxel of each individual and then averaged within the selected brain regions. For all panels, we report the average effect across individuals (n = 304), with the 95% CIs across individuals (b,d,f). P values were assessed with a two-sided Wilcoxon signed-rank test across individuals. In a,c,e, P values were corrected for multiple comparisons across voxels using the FDR and brain maps are thresholded at P < 0.01. The boxplot in g summarizes the distribution of the effect obtained on ten distinct and random subdivisions of the dataset.

