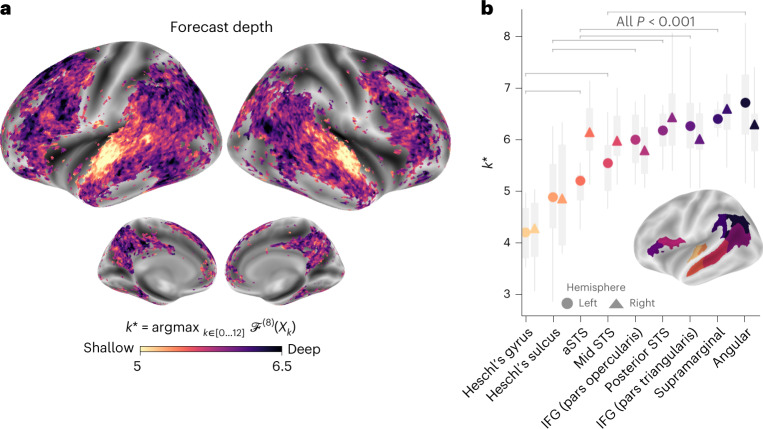
Fig. 3. Organization of hierarchical predictions in the brain.
a, Depth of the representation that maximizes the forecast score in the brain, denoted k*. Forecast scores were computed for each depth, individual and voxel, at a fixed distance of d* = 8 and averaged across individuals. We computed the optimal depth for each individual and voxel and plotted the average forecast depth across individuals. Dark regions are best accounted for by deep forecasts, while light regions are best accounted for by shallow forecasts. Only significant voxels are colour-coded as in Fig. 2c). b, Same as a but with k* averaged across the voxels of nine regions of interest, in the left (circle) and right (triangle) hemispheres. Scores were averaged across individuals (n = 304) and the boxplot summarizes the distribution of the effect obtained on ten distinct and random subdivisions of the dataset. Pairwise significance between regions was assessed using a two-sided Wilcoxon rank-sum test on the left hemisphere’s scores (the grey bars indicate P < 0.001).

