
Figure 3.
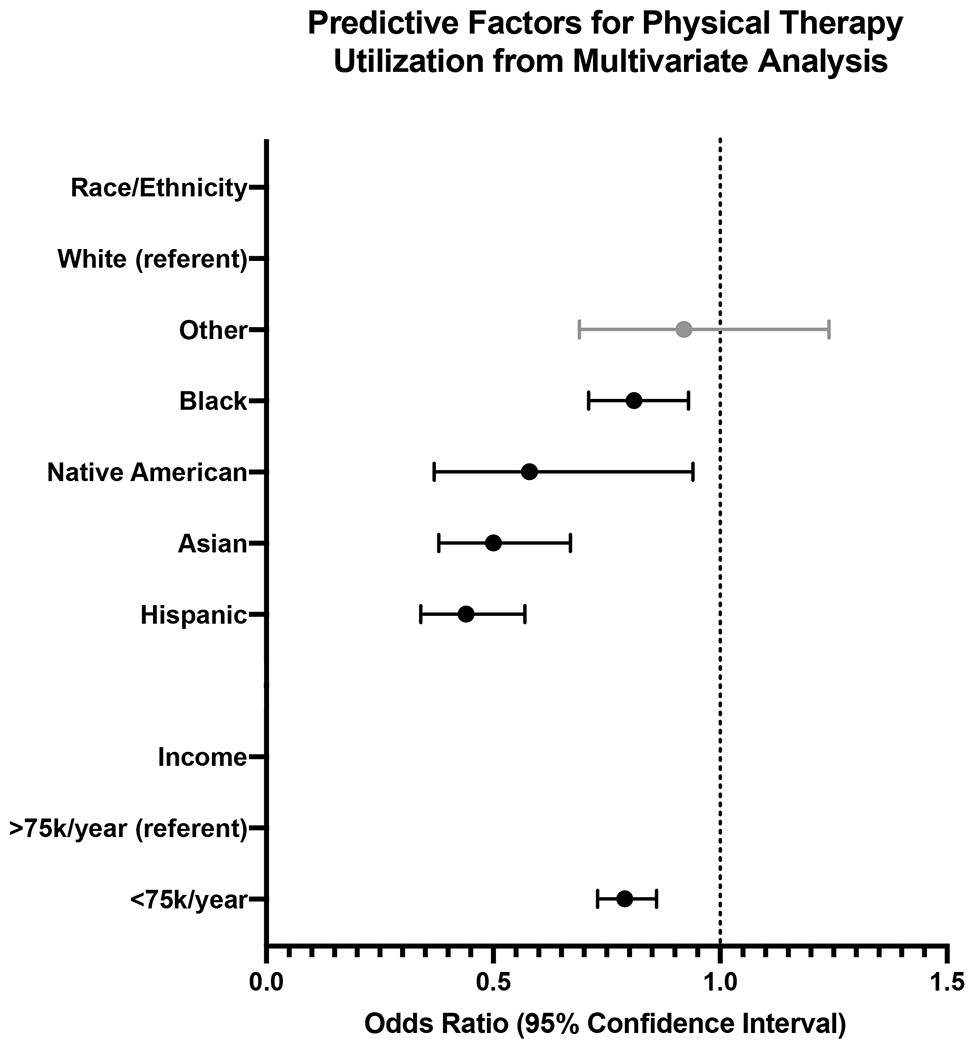
Forest plot depicting results of multivariate analysis for independent predictors of physical therapy utilization following TKA among race/ethnicity and average household income groups. Black bars represent statistically significant (P<0.05) difference in odds of receiving PT following TKA compared to referent category.