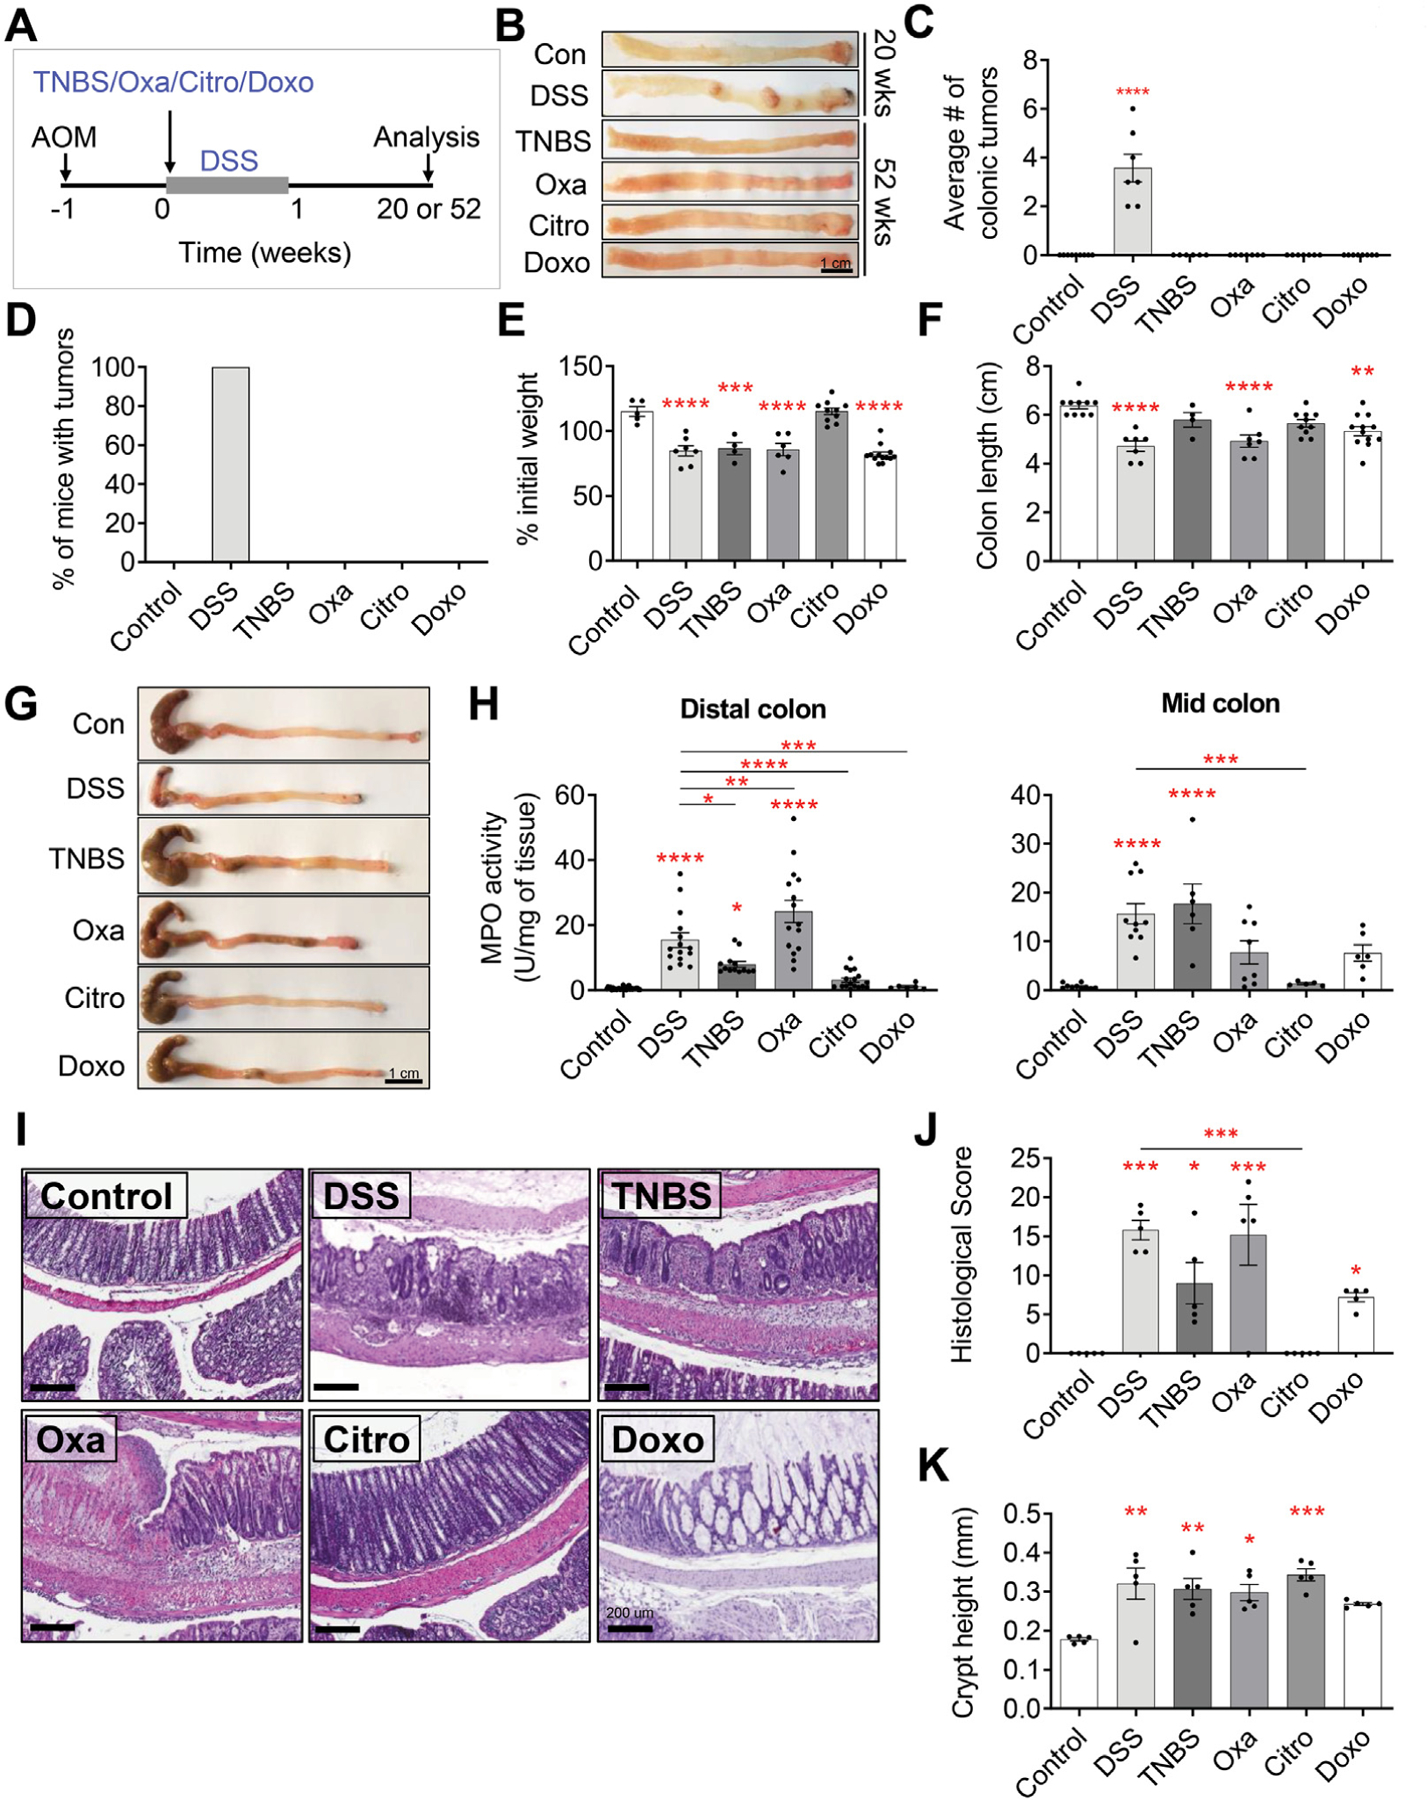
Figure 1.

Colitis-associated tumorigenesis is dependent on the type of inflammatory response. (A) Experimental setup to assess the propensity of DSS, TNBS, oxazolone (Oxa), C rodentium (Citro), and doxorubicin (Doxo) to induce tumorigenesis in C57BL/6J wild-type mice treated with intraperitoneal injection of 10 mg/kg AOM. (B–D) Gross pathology of the colon (B), average colonic tumor number per mouse (C), and percentage of mice (D) with colonic tumors in AOM-treated C57BL/6J wildtype mice treated with vehicle or various colitis-inducing agents (n ≥ 7 per group). (E–G) Percent of initial weight (E), longitudinal colon length (F), and gross pathology of the colon (G) at peak point of inflammation from C57BL/6J wild-type mice treated with vehicle or various colitis-inducing agents. Data collected on day 8 for control, DSS, and C rodentium, day 3 for TNBS and oxazolone, and day 4 for doxorubicin (n ≥ 5 per group). (H) MPO activity measured from the distal colon (left) and mid-colon (right) at peak point of inflammation from C57BL/6J wild-type mice treated with vehicle or various colitis-inducing agents (n ≥ 6 per group). (I–J) Representative H&E-stained sections of the colon (I) and their associated histologic score (J) at peak point of inflammation from C57BL/6J wild-type mice treated with vehicle or various colitis-inducing agents (n ≥ 5 per group). (K) Measurement of the crypt height (from crypt base to the luminal side) averaged from distal to proximal colon from C57BL/6J wild-type mice treated with vehicle or various colitis-inducing agents (n ≥ 5 per group). Data in all bar graphs are presented as mean ± SEM. Asterisks above each bar indicate significant differences from the control group. *P < .05, **P < .01, ***P < .001, ****P < .0001.
