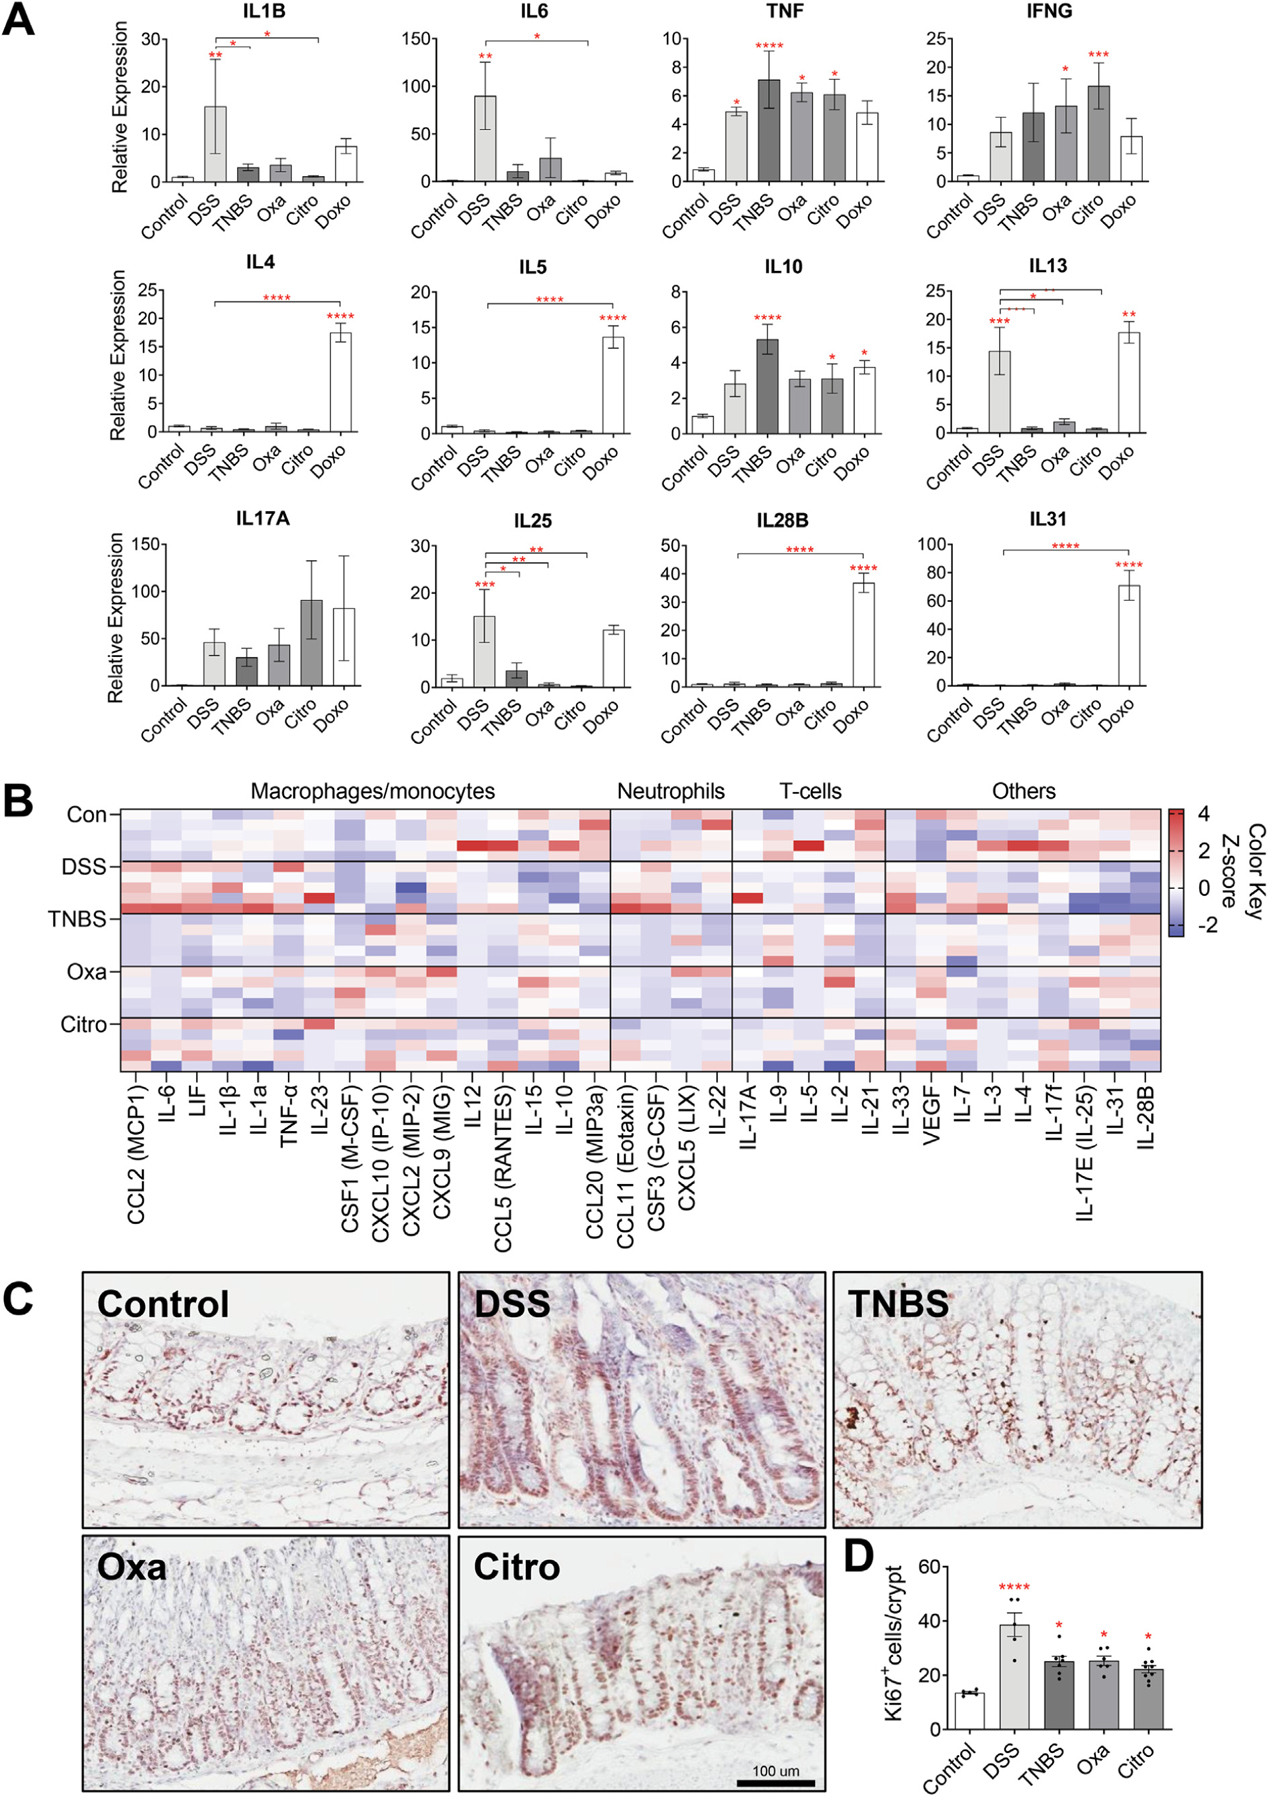
Figure 2.

Inflammatory responses differ among models of colitis. (A) Messenger RNA levels of inflammatory cytokines in the distal colonic tissues of C57BL/6J wild-type mice treated with various colitis-inducing agents, measured by means of quantitative reverse transcription polymerase chain reaction (n ≥ 6 per group). (B) Protein levels of inflammatory cytokines in the distal colonic tissues of C57BL/6J wild-type mice treated with various colitis-inducing agents (n = 5 per group). Data are shown as a heatmap, and cytokines are organized according to the associated immune cell type. (C) Representative high-power view of Ki67+ cells in the distal colonic tissues of C57BL/6J wild-type mice treated with various colitis-inducing agents. Scale bar: 100 μm. (D) Quantification of Ki67+ cells reveal increased number of proliferating cells in all colitis models compared with the control group and an increased number of proliferating cells in DSS-treated mice compared with other models of colitis (n ≥ 5 per group). Citro, C rodentium; Doxo, doxorubicin; Oxa, oxazolone. Data in all bar graphs are presented as mean ± SEM. Asterisks above each bar indicate significant differences from the control group. *P < .05, **P < .01, ***P < .001, ****P < .0001.
