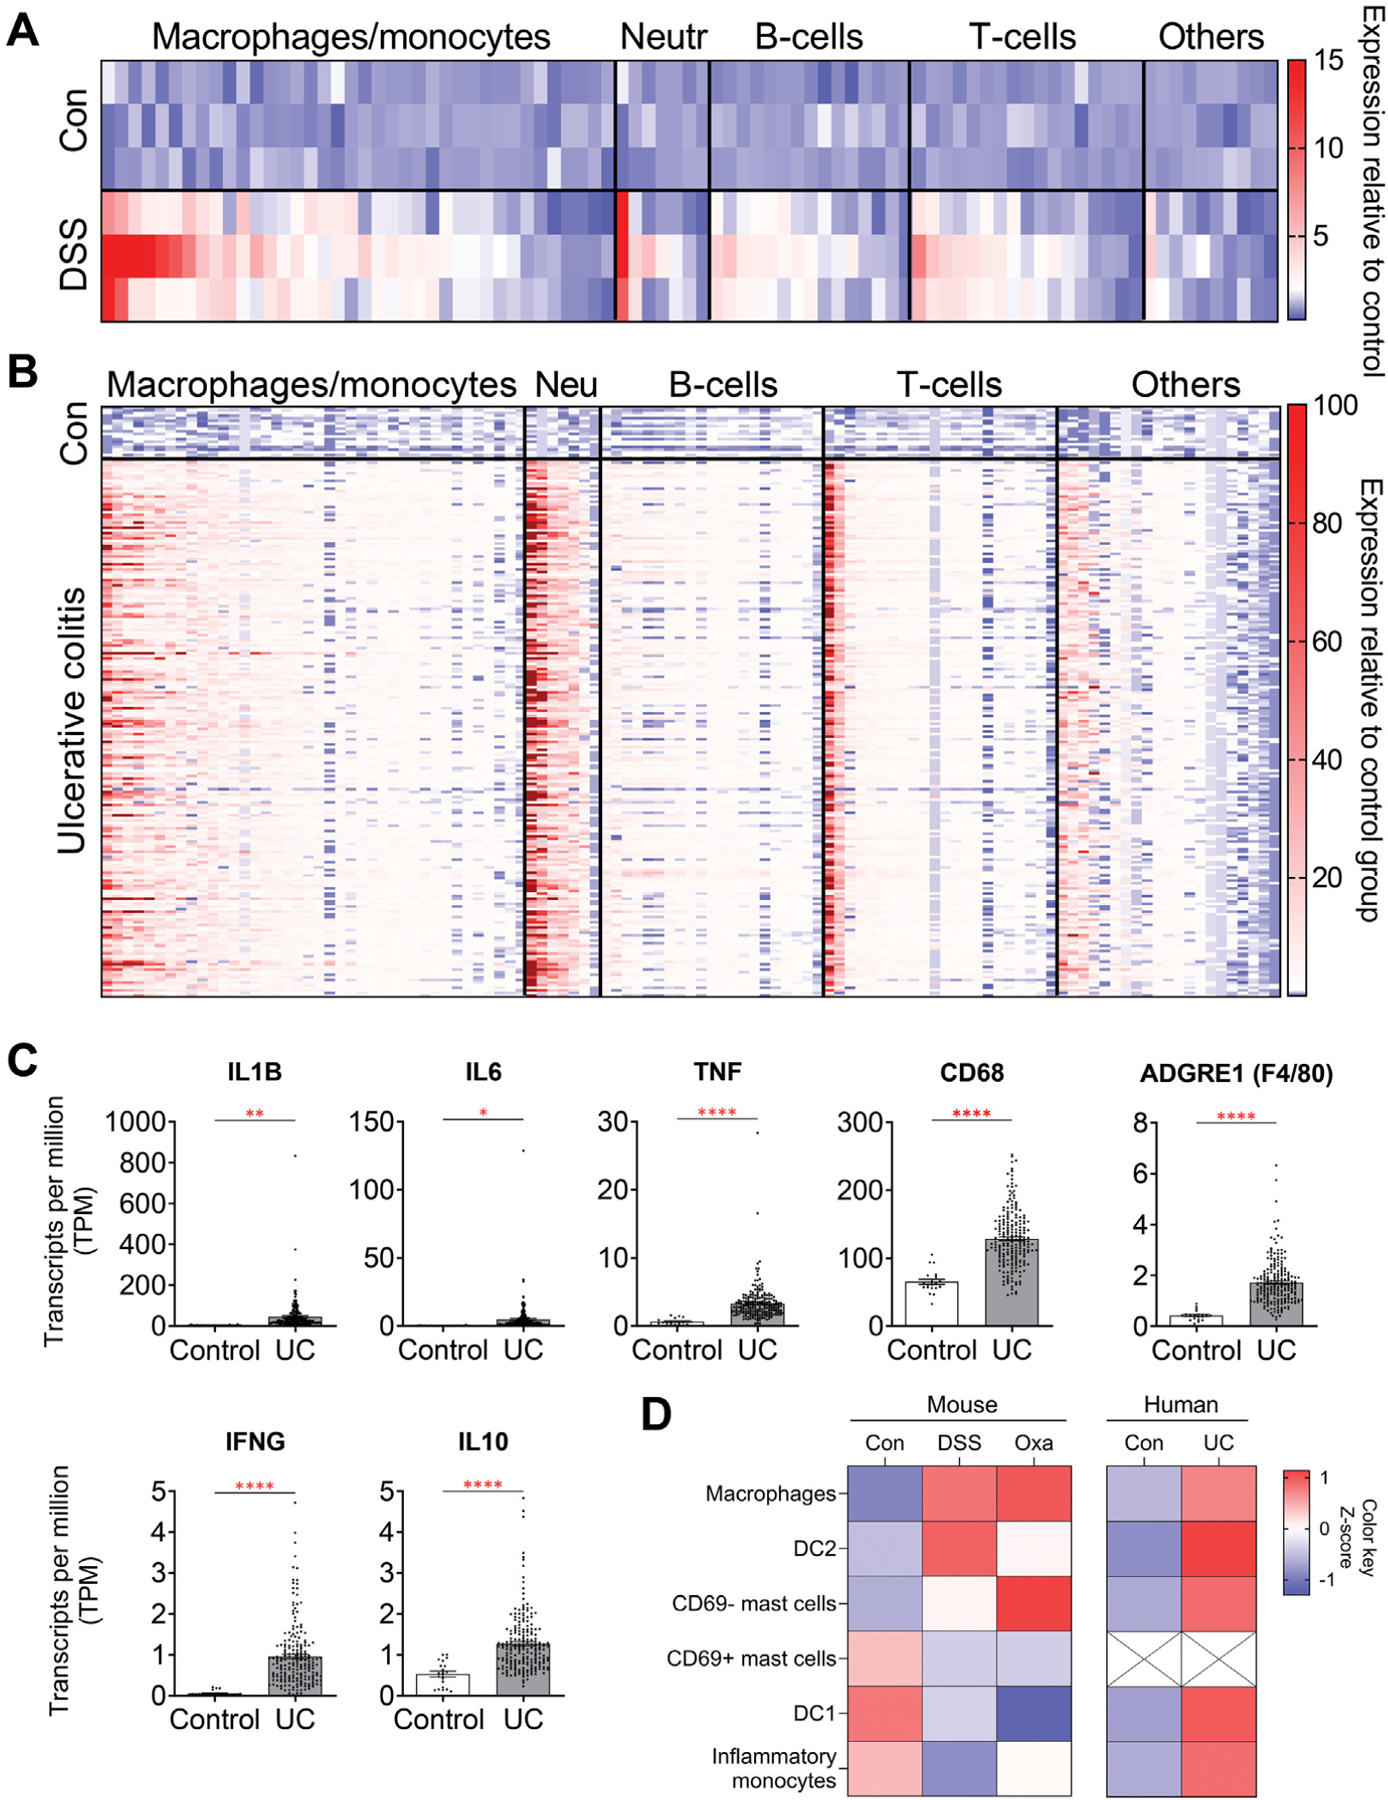
Figure 5.

DSS-induced colitis in mice has an inflammatory profile similar to that of patients with UC. (A) Expression profiles of inflammatory cytokines and chemokines from colonic tissues of mice treated with 2.5% DSS for 5 days and analyzed on day 8. Data were derived from Gene Expression Omnibus (GEO) data set GSE131032 and normalized to control samples (n = 3 in each group). (B) Expression profiles of inflammatory cytokines and chemokines from rectal mucosal biopsies collected before treatment in pediatric patients with new-onset UC. Data were derived from GEO data set GSE109142 and normalized to control samples (n = 20 healthy controls, n = 206 patients with UC). Results in panels A and B highlight the similarities in elevated cytokines associated with myeloid cells between DSS-treated mice and patients with UC. (C) Cytokines known to be associated with colonic inflammation and that were differentially regulated in our DSS-treated mice were also confirmed to be differentially regulated in patients with UC. Data were derived from GEO data set GSE109142. (D) Abundance of myeloid cells in mouse models of colitis and patients with UC, estimated using a gene signature matrix derived from previously published single-cell RNA-sequencing data sets of patients with UC.39 Data in all bar graphs are presented as mean ± SEM. *P < .05, **P < .01, ***P < .001, ****P < .0001.
