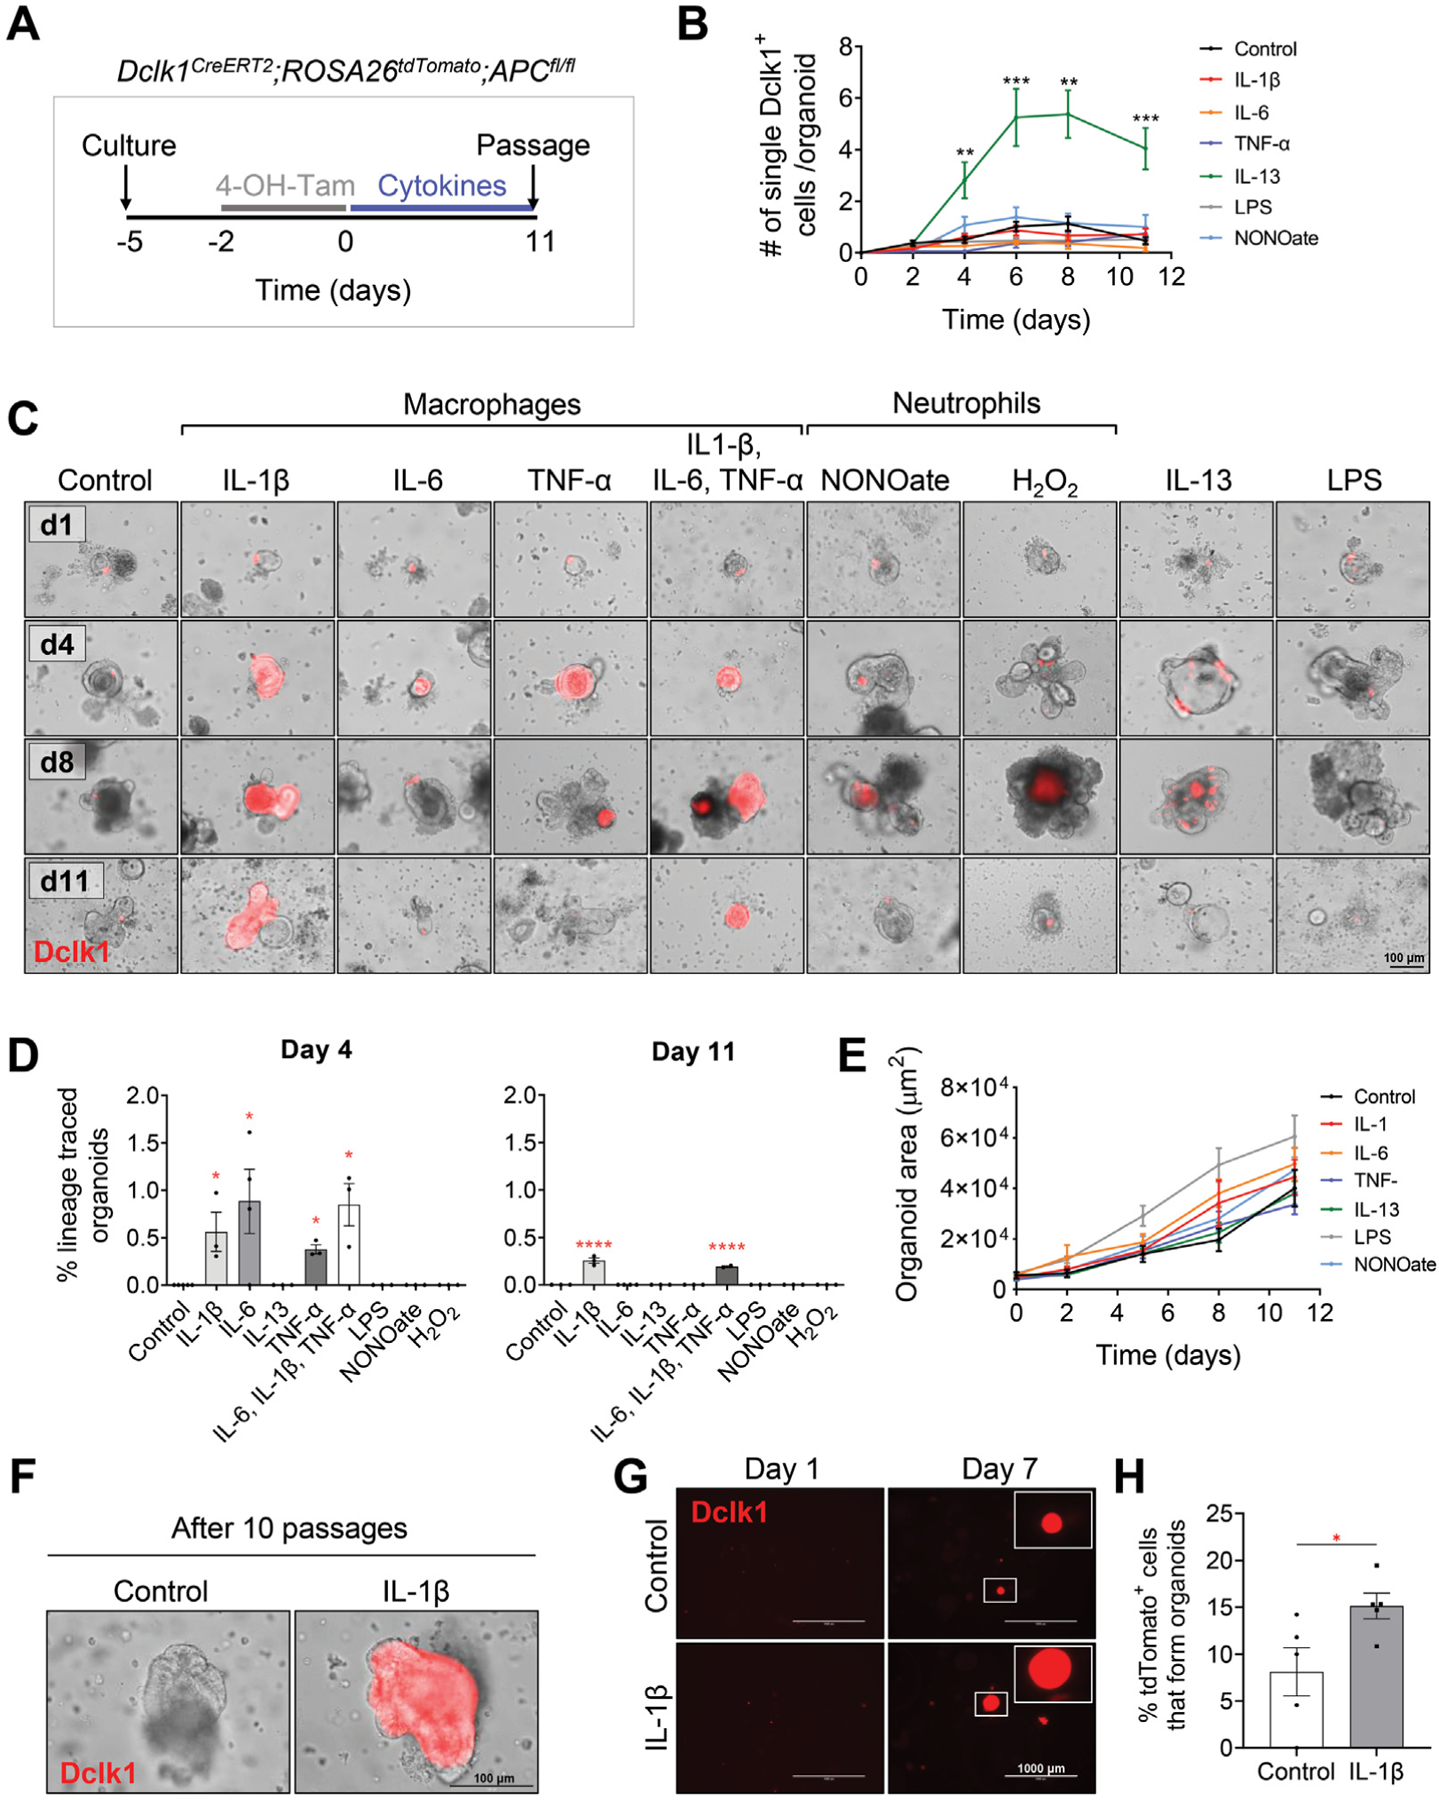
Figure 6.

Macrophage-secreted cytokines induce lineage tracing from tuft cells in vitro. (A) Experimental setup to assess the effects of incubating inflammatory cytokines/agents with intestinal organoids cultured from proximal intestinal tissues of Dclk1CreERT2;R26tdTomato;APCfl/fl mice. (B) Quantification of Dclk1+ cells in organoids incubated with the indicated treatments. Data are collected from 3 biological replicates and are expressed as the number of single tdTomato+ cell per organoid. LPS, lipopolysaccharide. (C, D) Representative images of organoids (C) and quantification of traced organoids on days 4 and 11 (D) identify macrophage-secreted cytokines as the important factors for Dclk1+ tracing. Traced organoids were quantified as the percentage of organoids displaying entire tdTomato+ crypt tracing over the total number of organoids with detectable tdTomato+ cells. (E) Quantification of the organoid area represented as μm2 over time. Morphology and growth of organoids are not different between each group. (F) Dclk1+ tracing induced by incubation with IL-1β is maintained for over 10 passages. (G) Representative images of single cell–derived Dclk1CreERT2;R26tdTomato;APCfl/fl organoids on days 1 and 7 following culture in the presence of vehicle vs IL-1β, and (H) quantification of tdTomato+ cell–derived organoids 7 days after culture in vehicle vs IL-1β. Data in all bar graphs are presented as mean ± SEM. Asterisks above each bar indicate significant differences from the control group. *P < .05, **P < .01, ***P < .001, ****P < .0001.
