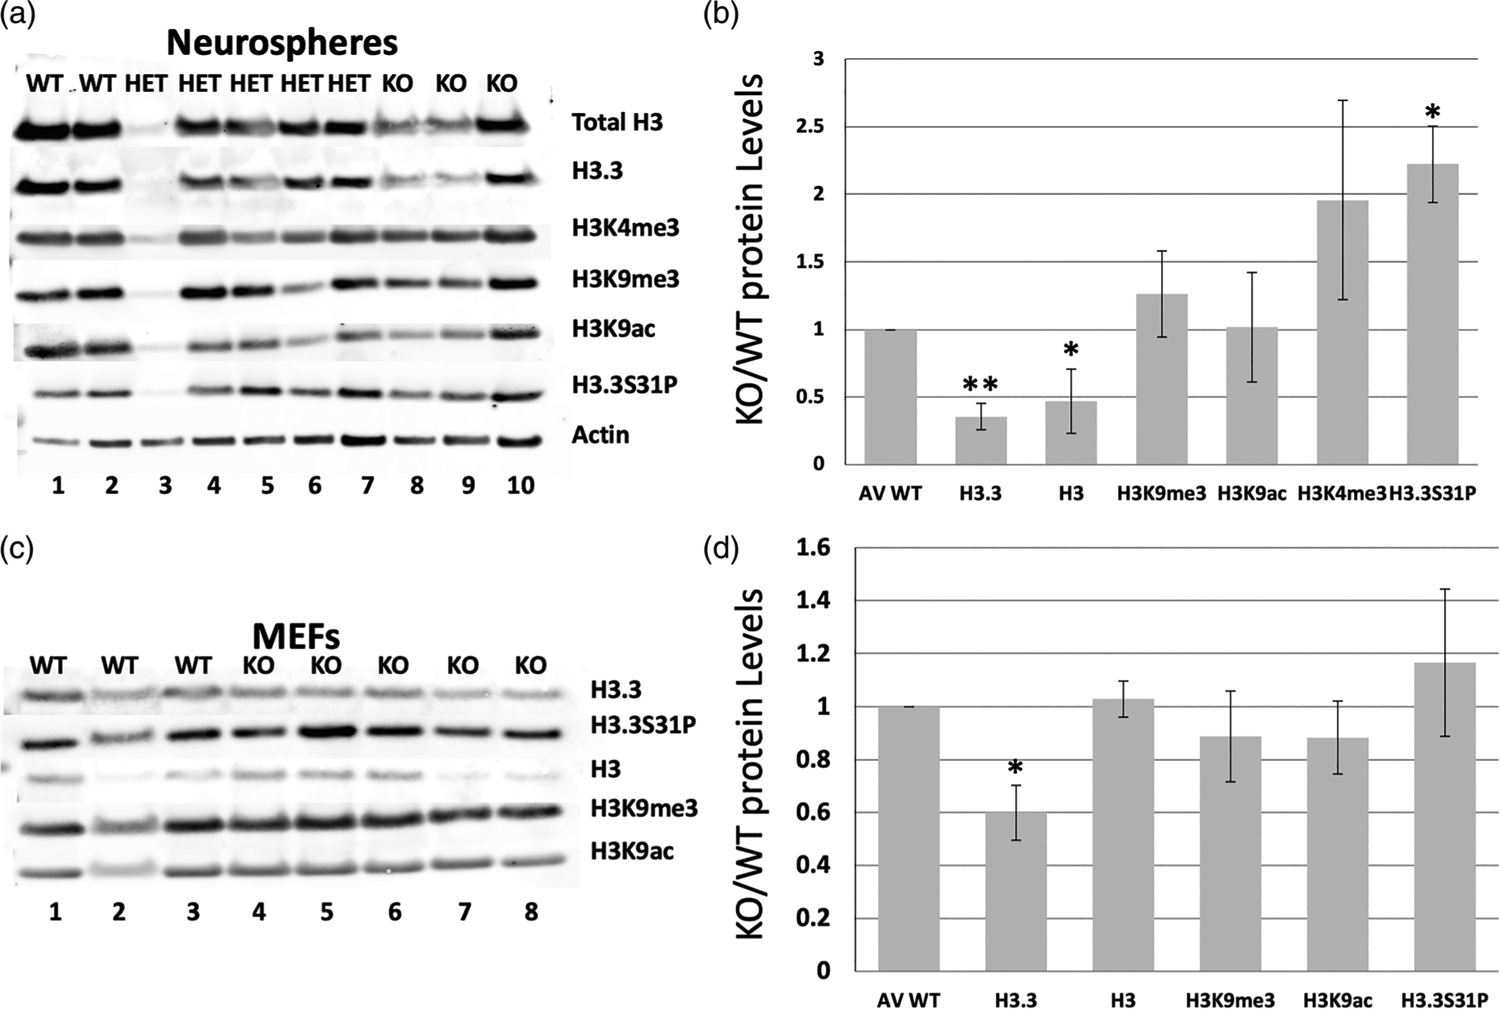
FIGURE 4.

Loss of H3f3a strongly reduces both total H3 and H3.3 protein levels, but only impacts some histone H3 family marks. Histone extracts were isolated from H3f3a null MEFs and neurospheres, and analyzed by Western blot for total H3, H3.3, and a panel of histone marks. (a–b) Western blots for the indicated histone marks and controls of total H3, total H3.3, and b-Actin levels in neurospheres. (c–d) Western blots for the indicated histone marks and controls of total H3, total H3.3, and b-Actin levels in MEFs. Error bars are standard deviations. P values are <.05 and <.005 for * and ** marked samples. MEFs and neurospheres were derived from two WT, five heterozygous, and three null embryos here for histone mark protein level analysis
