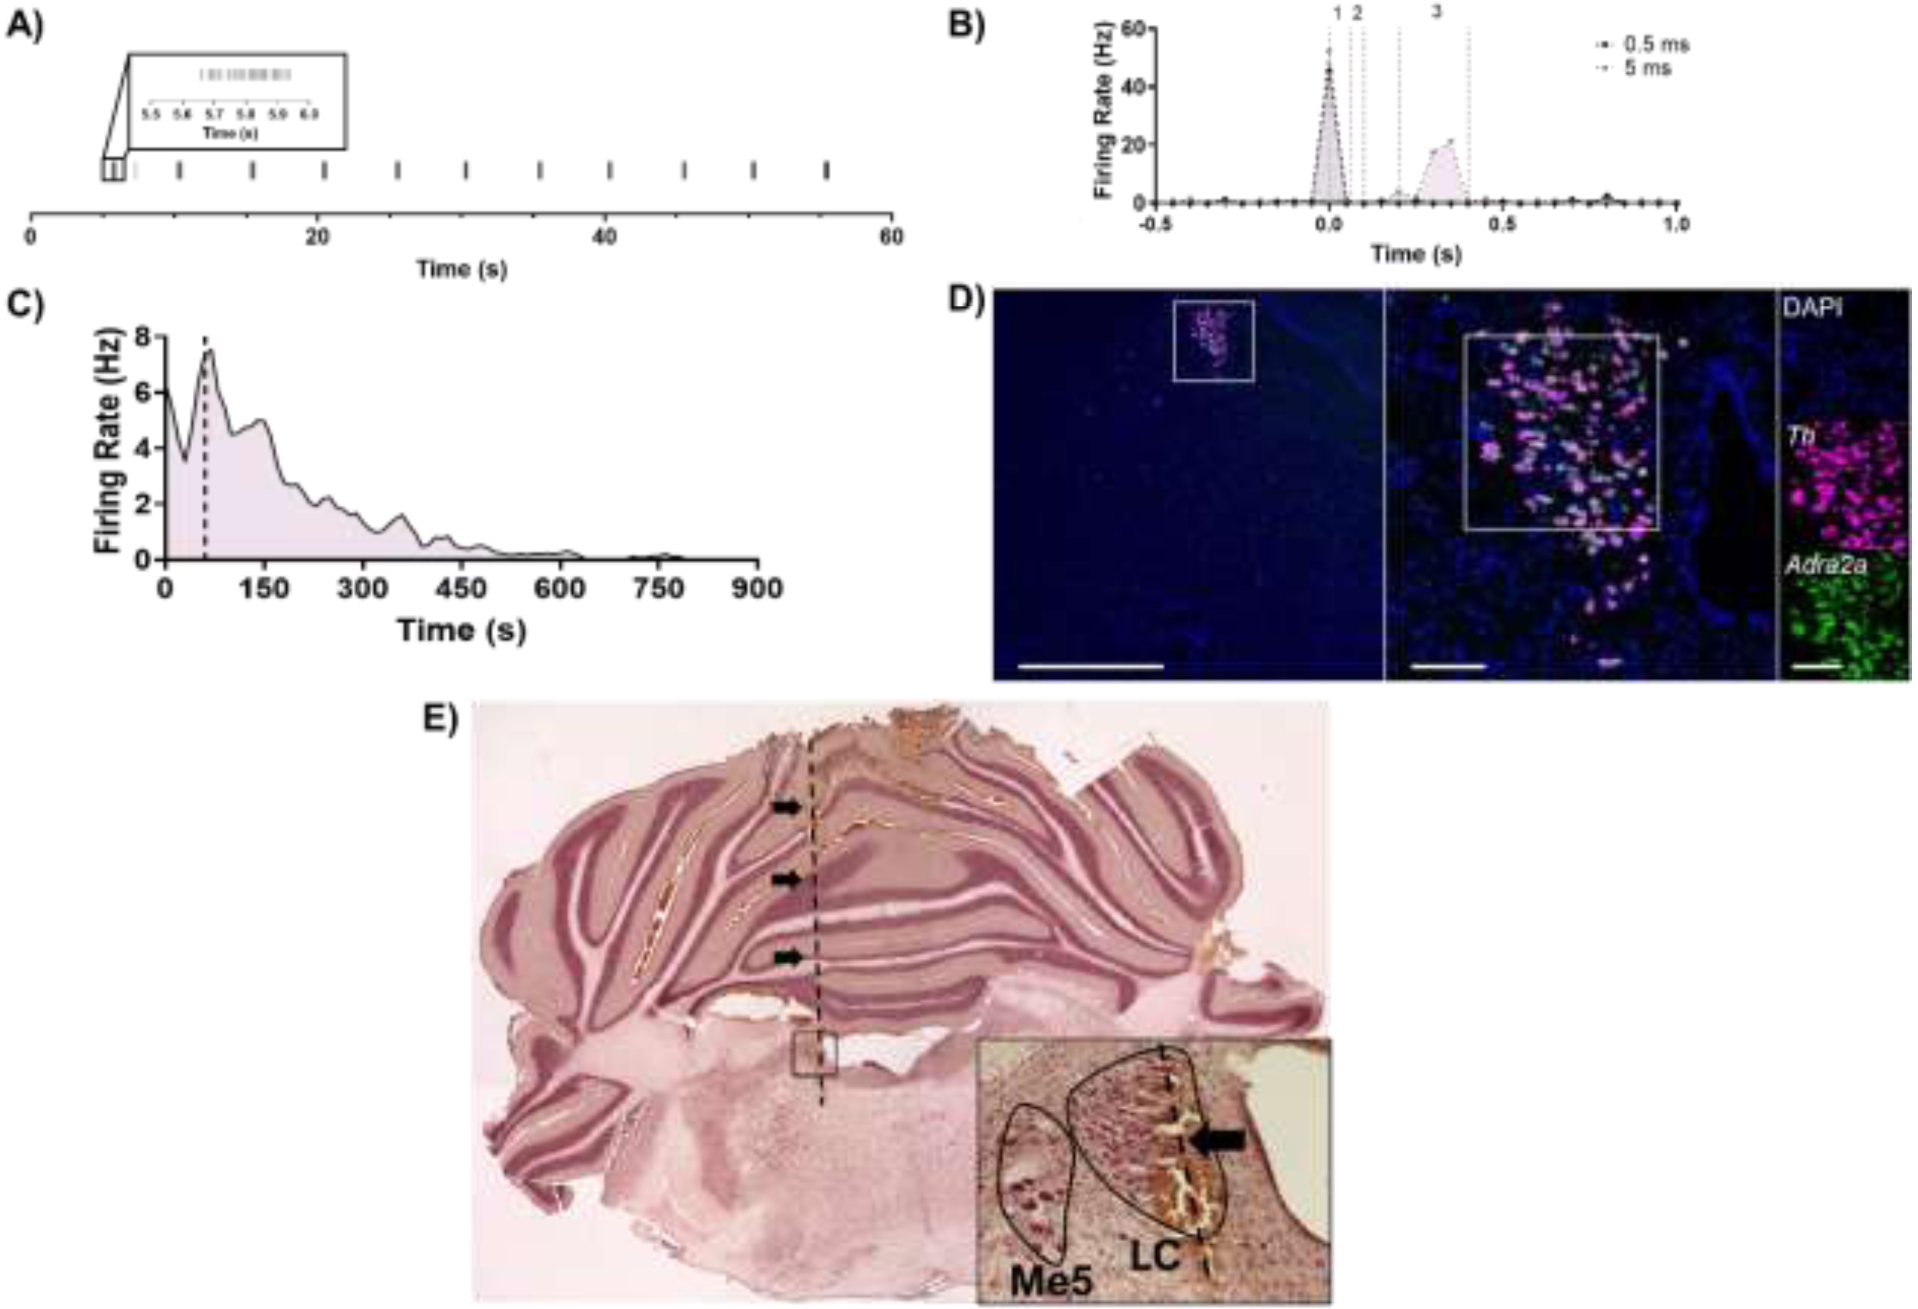
Figure 1. Multimodal confirmation of single unit recordings from LC neurons.

A) The approximate depth of the LC was estimated by locating Me5 via jaw deflection every 5 s during 1-min long recording. B) Putative LC units displayed a biphasic response to footshock (gray, 0.5 ms; purple, 5 ms; 0.05 ms bins around footshock at time 0 s). Unit responses were also quantified between 0–60 ms (1), 60–100 ms (2), and 200–400 ms (3) following footshock. C) Noradrenergic LC neuron activity is inhibited by the α2-adrenergic receptor clonidine (0.1 mg/kg i.p.; dashed line), and D) RNAscope performed at the level of the LC confirmed that expression of α2-adrenergic receptors (green) is limited to TH-expressing (magenta) LC neurons in this part of the brain. Scale bars: 1 mm at 2x, 100 μm at 20x, and 100 μm at 40x magnification. E) Localization of electrode tracks (arrows and dashed line) in the LC core using neutral red counterstaining. Main image stitched from four images at 2x magnification. Inset taken at 20x magnification with the LC outlined in black and the electrode track marked by an arrow.
