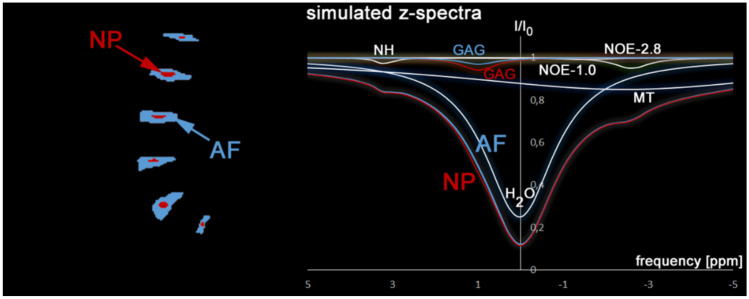
Fig. 8.
Phantom 2 shows a structure of the intervertebral discs of the lumbar spine. Two areas are defined within each disc: Nucleus pulposus (NP) and Annulus fibrosus (AF). On the right, the simulated spectra of NP (red) and AF (blue) including the individual CEST components (H2O, GAG, MT, NOE-1.0, NOE-2.8, NH) are shown. The individual GAG components of NP (red) and AF (blue) are displayed separately. All other components were held constant in both regions

