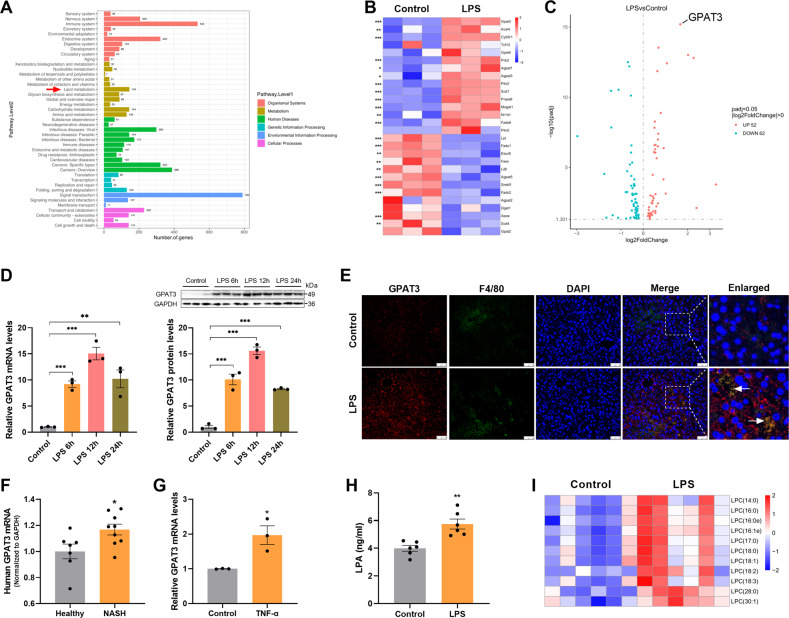
Fig. 1. Inflammatory activation results in the high GPAT3 expression.
A GO analysis of differentially expressed genes (DEGs) in the normal and LPS-stimulated KCs (stimulated with 1 μg/ml LPS for 24 h). DEGs were classified under six categories as indicated. Red arrow indicates lipid metabolism as the top-ranking affected metabolism pathway (n = 3). B Heatmap showing the expression of lipid metabolism pathway genes, as measured using transcriptomics, in the normal and LPS-stimulated KCs (n = 3). C Volcanic map showing the GPAT3 was the most significant difference among lipid metabolism genes after LPS stimulated KCs for 24 h (n = 3). D qPCR and Western blot analysis of GPAT3 expression in normal and LPS (100 ng/ml)-stimulated KCs at different time points (n = 3). E Immunofluorescence staining for GPAT3 expression in KCs from the LPS-treated liver mice tissues. F4/80 was used as a KCs marker. DAPI was used to visualize nuclei. Scale bars represent 50 μm (n = 3). F The mRNA expression of GPAT3 in human liver from the healthy and NASH (7 healthy human and 9 NASH patients, Database were obtained from GEO database: http://www.ncbi.nlm.nih.gov/geo/, Data set number is GSE63067). G GPAT3 mRNA expression in KCs after stimulated with TNF-α (100 ng/ml) for 24 h (n = 3). H LPA concentrations in the supernatant of KCs after stimulated with LPS for 24 h (n = 6). I Lipidomic analysis showing the levels of different LPC species levels in KCs (n = 6). Data represents mean ± SEM. *P < 0.05, **P < 0.01, ***P < 0.001.

