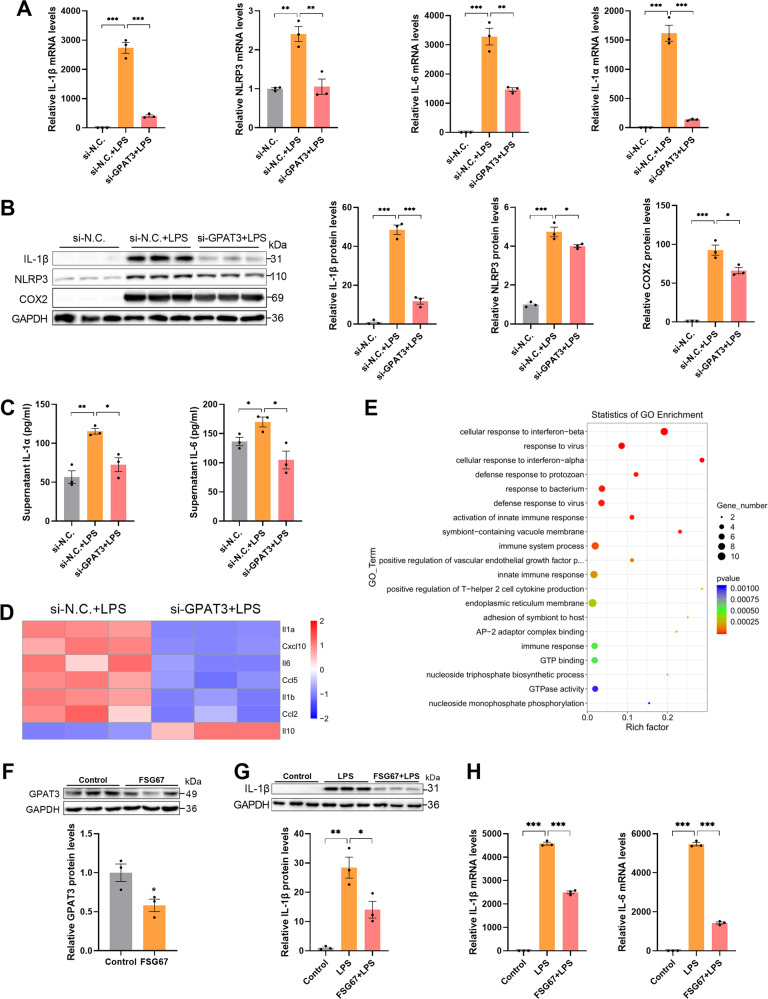
Fig. 2. Blocking GPAT3 decreases inflammatory response in LPS-stimulated Kupffer cells.
A The mRNA expression of IL-1α, IL-6, IL-1β and NLRP3 in si-N.C. or si-GPAT3 KCs with or without LPS (100 ng/ml, 12 h) (n = 3). B, C The protein levels of IL-1β, NLRP3, COX2, IL-1α and IL-6 in si-N.C. or si-GPAT3 KCs with or without LPS (100 ng/ml, 12 h) (n = 3). D Heatmap showing the inflammatory cytokines genes expression in LPS-stimulated KCs with or without si-GPAT3 as measured by transcriptomics (n = 3). E Scatter plot of GO enrichment differential genes of si-N.C. vs si-GPAT3 (n = 3). F The expression of GPAT3 in KCs treated with FSG67 (150 μM, 1 h) was analyzed by Western blot and qPCR (n = 3). G, H The levels of IL-1β and IL-6 in KCs were pretreated with 150 μM FSG67 for 6 h and then were treated with 100 ng/mL LPS for 6 h (n = 3). Data represents mean ± SEM. *P < 0.05, **P < 0.01, ***P < 0.001.

