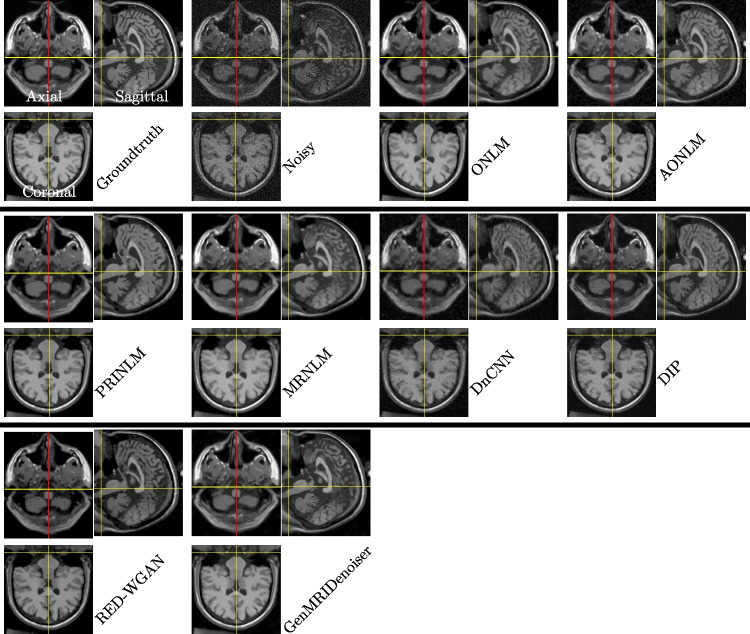
Fig. 3.
Results on simulated Brainweb-T1 dataset for slice thickness 1mm. The results of the comparing methods are shown for the noise level . Each figure in a group shows the axial (top left), sagittal (right) and coronal (down) planes. Upon careful visualization, it can be observed that the proposed methodology removes noise along with the preservation of details. This is more evident in the axial and coronal sections

