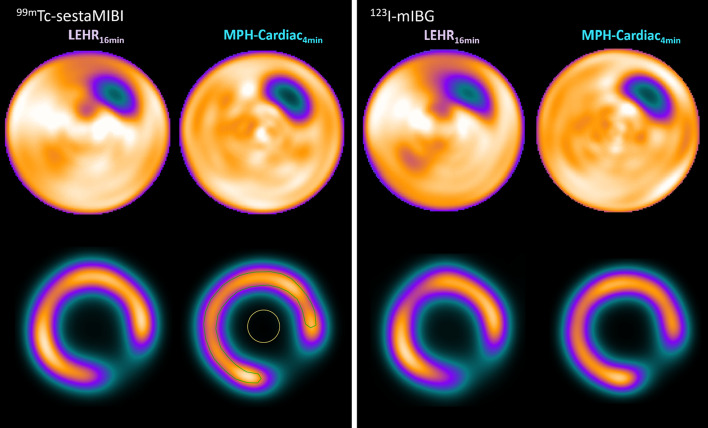
Fig. 4.
Polar Map representations of the Data Spectrum LV insert phantom filled with 99mTc (left upper row) and 123I (right upper row) measured with the AnyScan SC with LEHR 16 min acquisition and the AnyScan TRIO with MPH-Cardiac collimator 4 min acquisition. Short axis images of the reconstructed LV inserts are presented for the 99mTc (left lower row) and 123I (right lower row) measurements. Half-moon shaped ROI was applied on both the myocardium region of the phantom (green) and a circular ROI within the LV cavity (yellow). These ROIs were applied on all four LV SPECT images and CNR values were calculated based on Eq. 3

