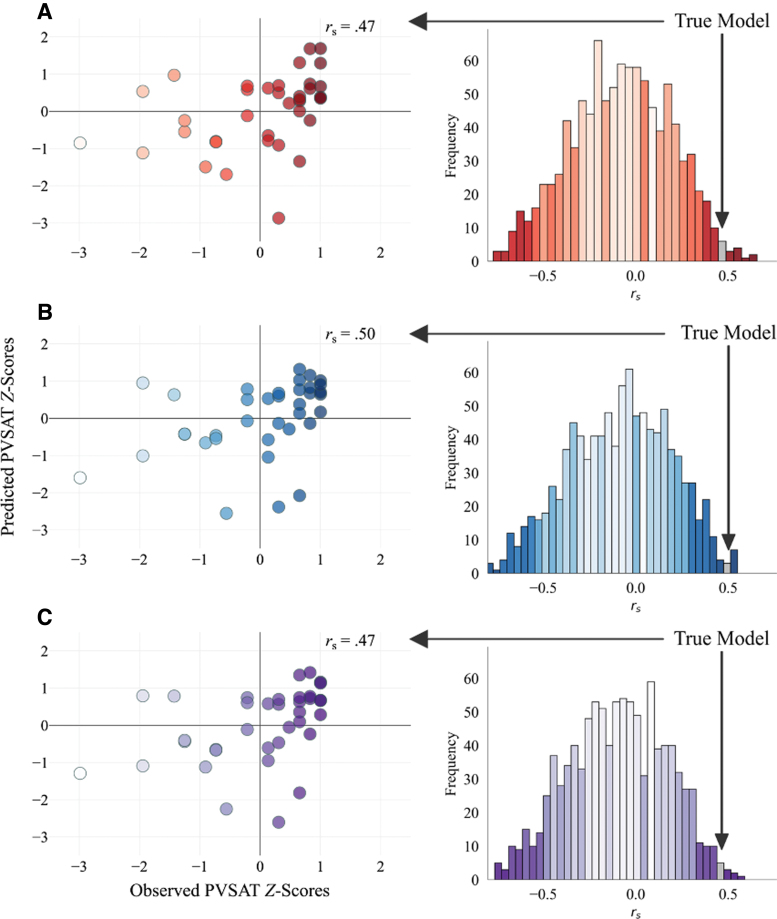
FIG. 1.
Internal model fit with permutation testing in the derivation sample. On the left are observed PVSAT Z-scores plotted against predicted PVSAT Z-scores from the: (A) high MS-wmCPM, (B) low MS-wmCPM, and (C) full MS-wmCPM networks. Z-scores presented for visualization purposes. Annotations represent Spearman correlation coefficients between predicted and observed scores. Each scatterplot is paired with its respective null distribution of 1000 correlations between predicted and observed PVSAT scores from the CPM procedure with randomly shuffled brain–behavior pairings. The gray bar depicts the Spearman's rank correlation between predicted and observed scores for the true model with actual brain–behavior pairings. Scatterplots and histograms were created by using the python matplotlib package. CPM, connectome-based predictive modeling; MS, multiple sclerosis; MS-wmCPM, connectome-based predictive model of WM in MS; PVSAT, Paced Visual Serial Addition Test; WM, working memory. Color images are available online.

