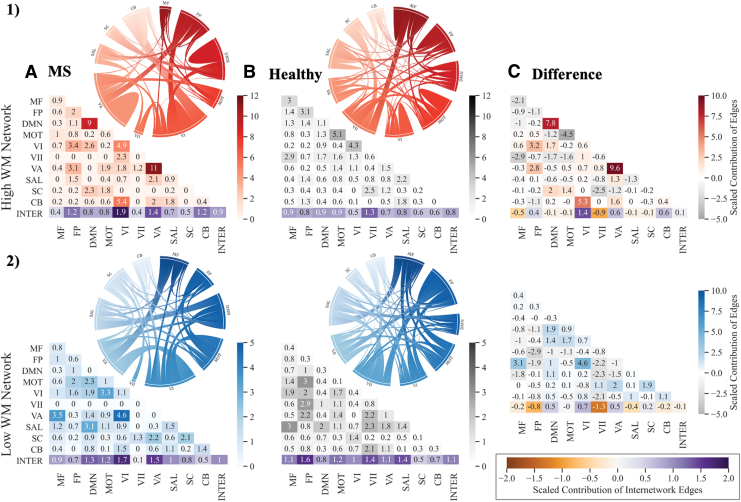
FIG. 3.
Contribution of canonical networks to wmCPMs. Contribution of canonical networks to the high wmCPM (top panel) and low wmCPM (bottom panel). (A) Includes networks derived in individuals with MS (MS-wmCPM); (B) includes networks derived in Avery et al. (2020) using the HCP dataset (wmCPM); and (C) represents differences between the MS-Healthy. Degree of contribution is represented by color opacity; for the third column representing difference, positive (red or blue) values indicate greater contribution in MS networks and negative (gray) values indicate greater contribution in healthy networks. Diagonals represent intranetwork contribution, and the bottom row depicts the average internetwork contribution. The overall average internetwork contribution is presented as the last value (at the intersection of Inter-Inter in the matrices). Value >1 indicates a disproportionately large contribution. Matrices were generated by using the seaborn python package, and ring plots were constructed by using Flourish software. CB, cerebellar; DMN, default mode network; FP, frontoparietal; HCP; Human Connectome Project; INTER, Internetwork; MF, medial frontal; MOT, motor; MS, multiple sclerosis; MS-Healthy, MS relative to healthy networks; SAL, salience; SC, subcortical; VI, Visual I ; VII, Visual II; VA, Visual Association. Color images are available online.

