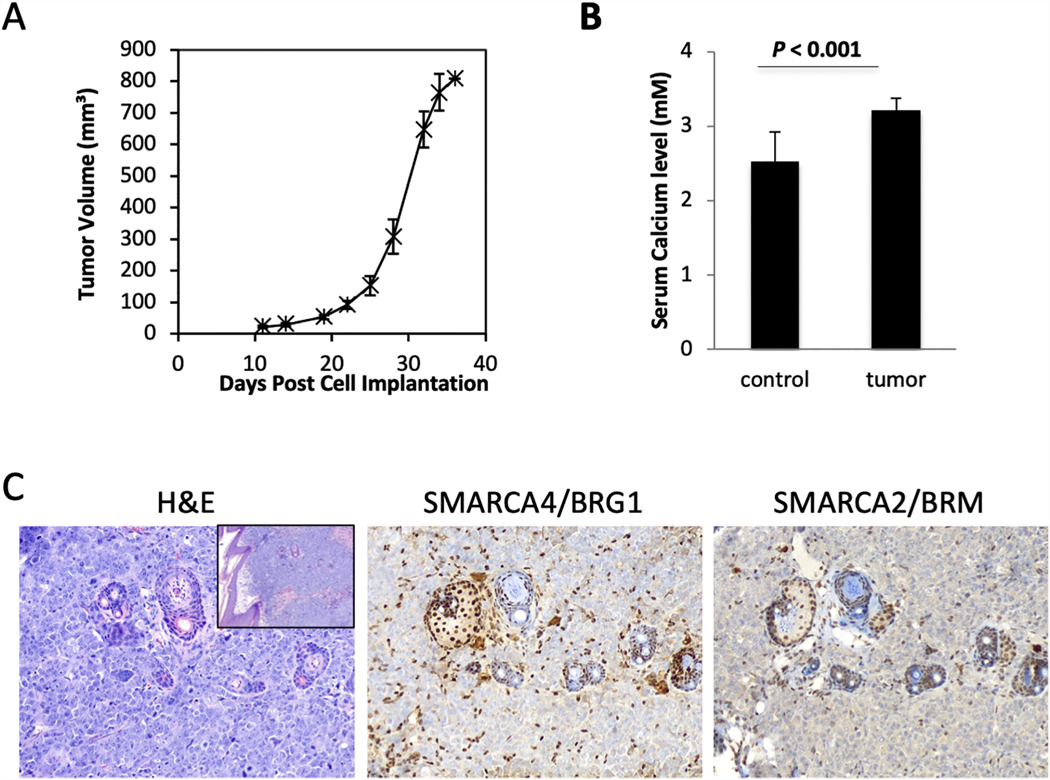
Figure 3.
COV434 mouse xenografts. A. Growth curve upon subcutaneous injection of COV434 cells into immunodeficient NRG mice (n=6). B. Serum calcium measurements of control and tumour-bearing mice. C. H&E-stained sections and immunohistochemistry for SMARCA4 and SMARCA2 of tumor bearing xenografts. Cells with nuclear staining of both proteins represent internal positive controls: lymphocytes, stromal cells, and entrapped follicular structures. Main 3 images at 200x magnification. H&E inset (left panel) at 100x magnification.

