
Fig. 2. Characterization of P-SCLC developed by Trp53fl/fl;p16fl/fl;Nrf2E79Q/+ mice.
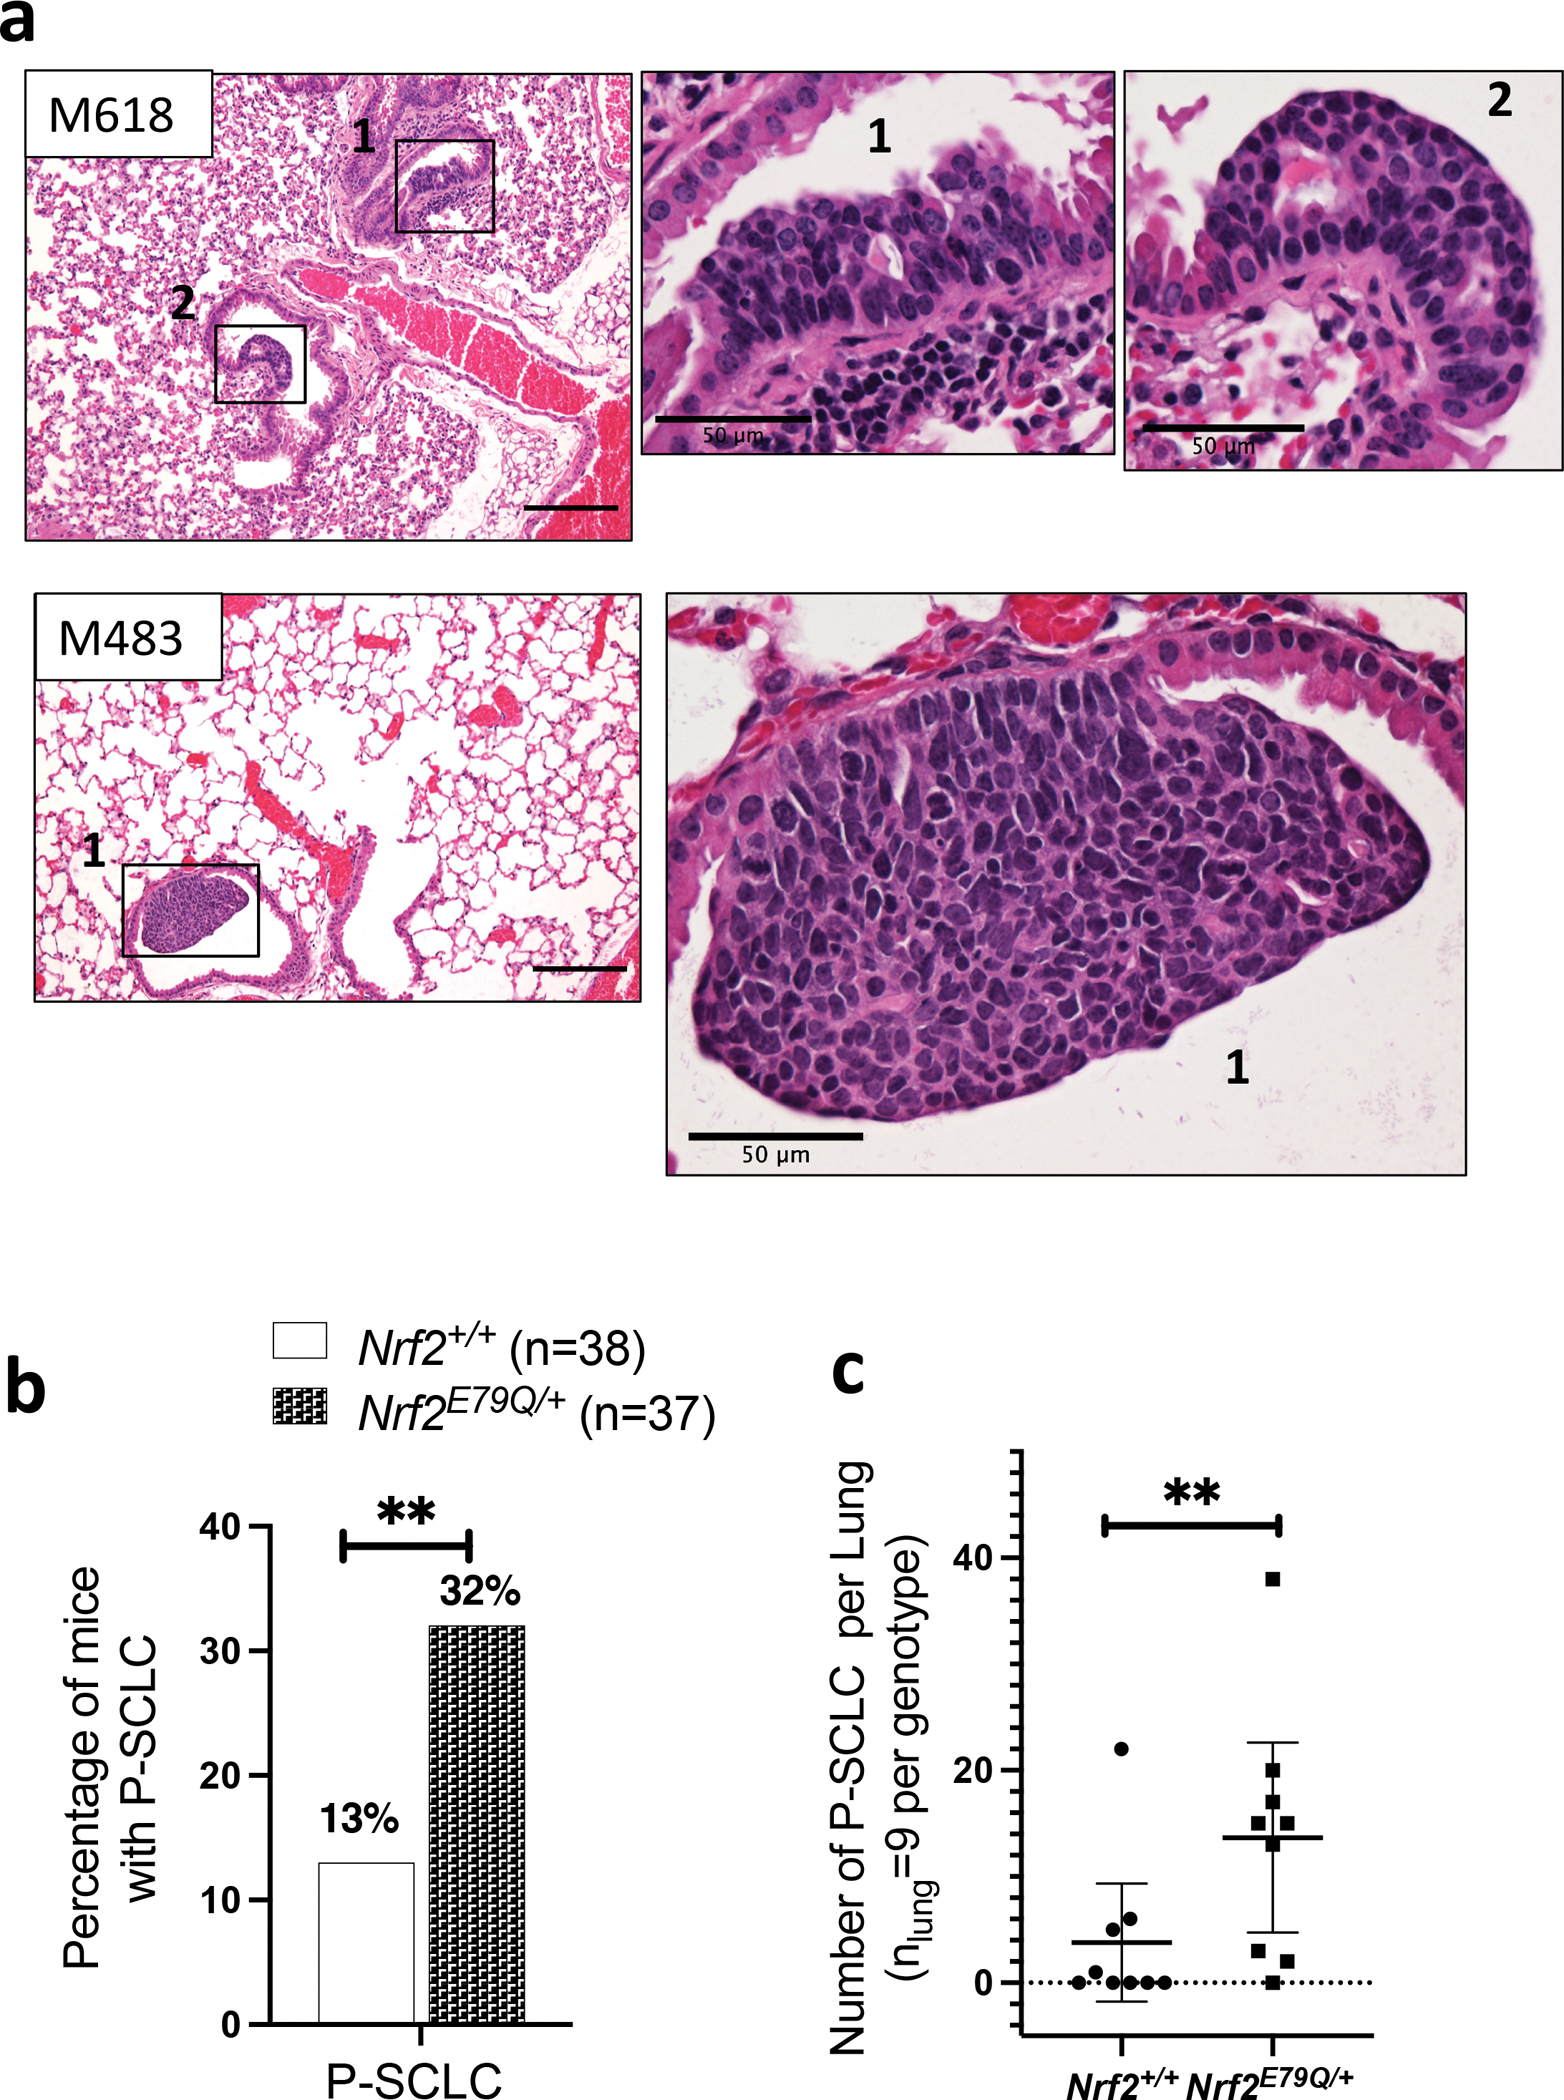
a H&E of multiple P-SCLCs in Trp53fl/fl;p16fl/fl;Nrf2E79Q/+ mice, scalebar=200μm with insets showing P-SCLC lesions, scalebar=50μm. Images were taken using a BX61-Neville microscope; b Percentage of mice with P-SCLC in Trp53fl/fl;p16fl/fl;Nrf2+/+ and Trp53fl/fl;p16fl/fl;Nrf2E79Q/+ mice; c Total number of P-SCLC observed in each lung from Trp53fl/fl;p16fl/fl;Nrf2+/+ and Trp53fl/fl;p16fl/fl;Nrf2E79Q/+ mice (n = 9 per genotype) (See Supplementary Table 2 for more details). **P<0.01