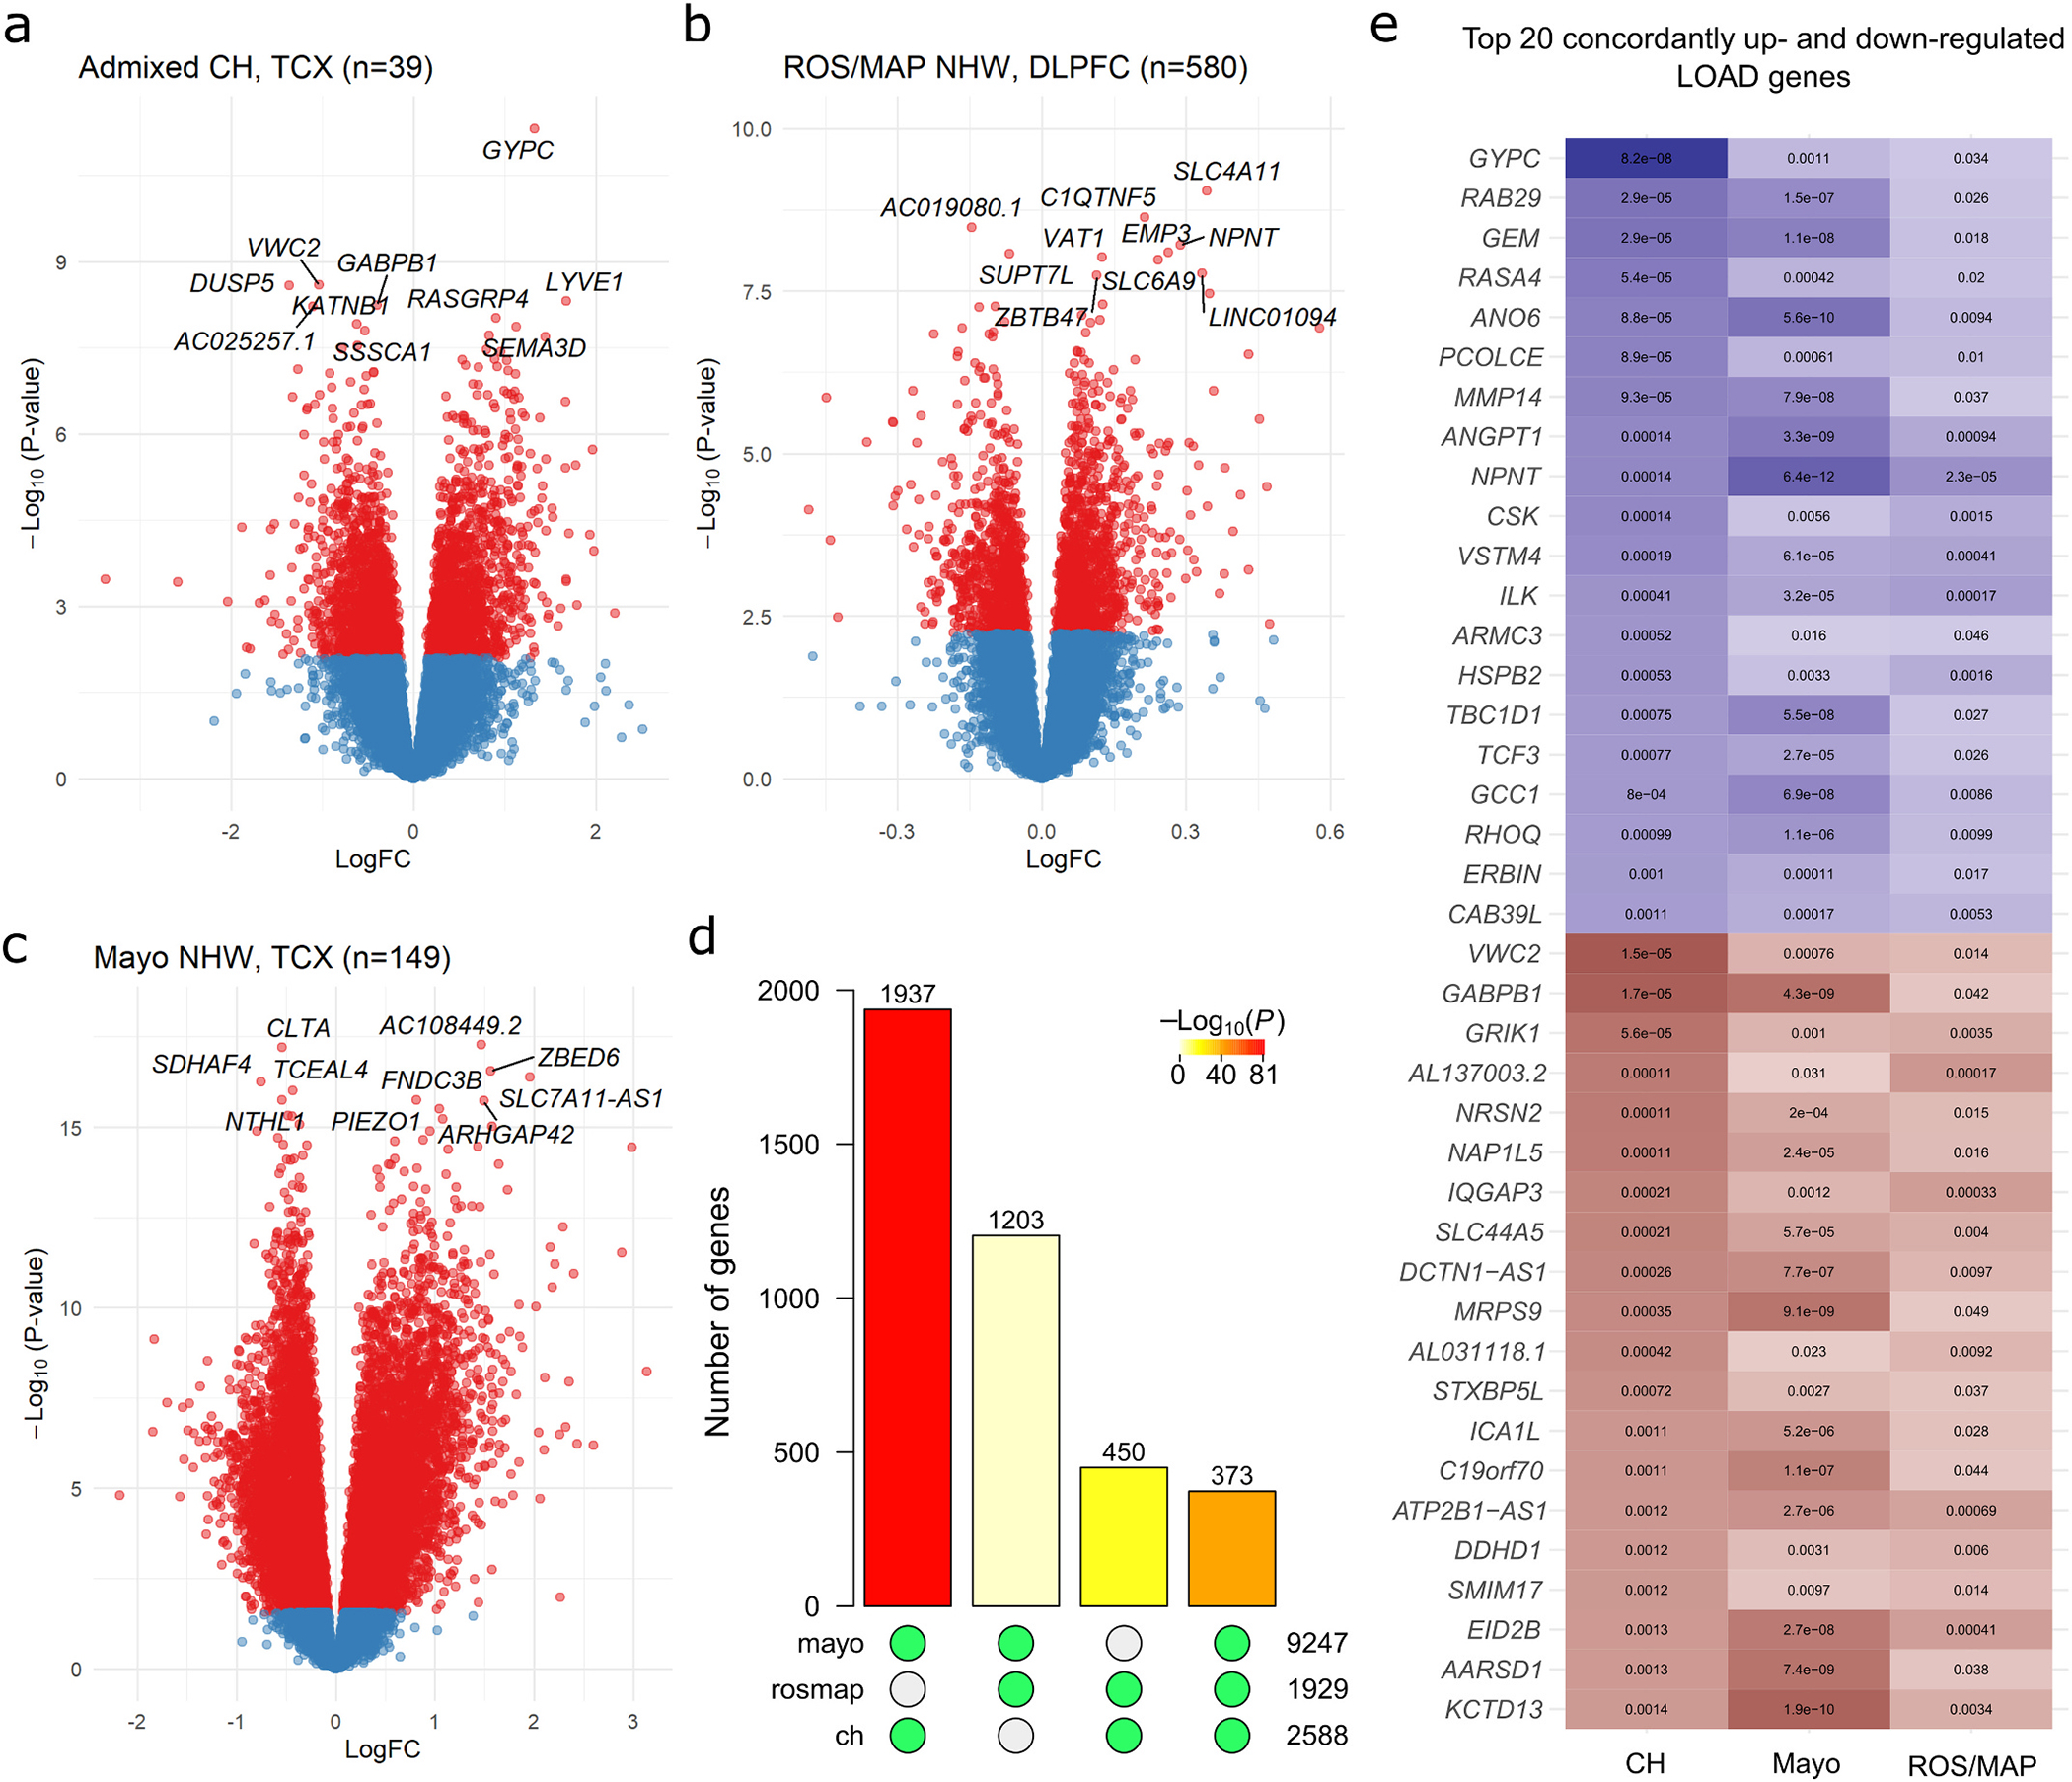
Fig. 2.

Results of single-gene transcriptome-wide associations with LOAD in Caribbean-Hispanics and non-Hispanic Whites. Gene-level volcano plots for association of genes with LOAD status in A) genetically-confirmed CH subjects (n = 39), and two independent samples of non-Hispanic whites: B) ROS/MAP and C) the Mayo RNAseq cohort. The top ten significantly differentially expressed genes in each analysis are labeled. The Y-axes indicate two-sided −log10(p-values) for robust regression testing differential expression The X-axes indicate log2 fold-change in expression. D) Barplot showing the number of transcriptome-wide FDR-significant (q < 0.05) differentially expressed genes in common between each pair of samples and across all three datasets. Green dots below each bar indicate which sets of significant genes are intersecting. Bar color indicates the p-value for hypergeometric testing of overlap probability (scale shown). E) The top 20 up- and top 20 down-regulated LOAD genes with significant, concordant effects across all three samples, ranked by significance in the CH sample. The color is proportional to moderated t-statistics (blue for positive effect, or higher expression in LOAD, and red for negative effect, or lower expression in LOAD), with FDR-adjusted two-sided p-values labeled inside of tiles. DLPFC = dorsolateral prefrontal cortex source tissue; LogFC = log2 fold-change in expression; NHW = non-Hispanic White; TCX = temporal cortex source tissue.
