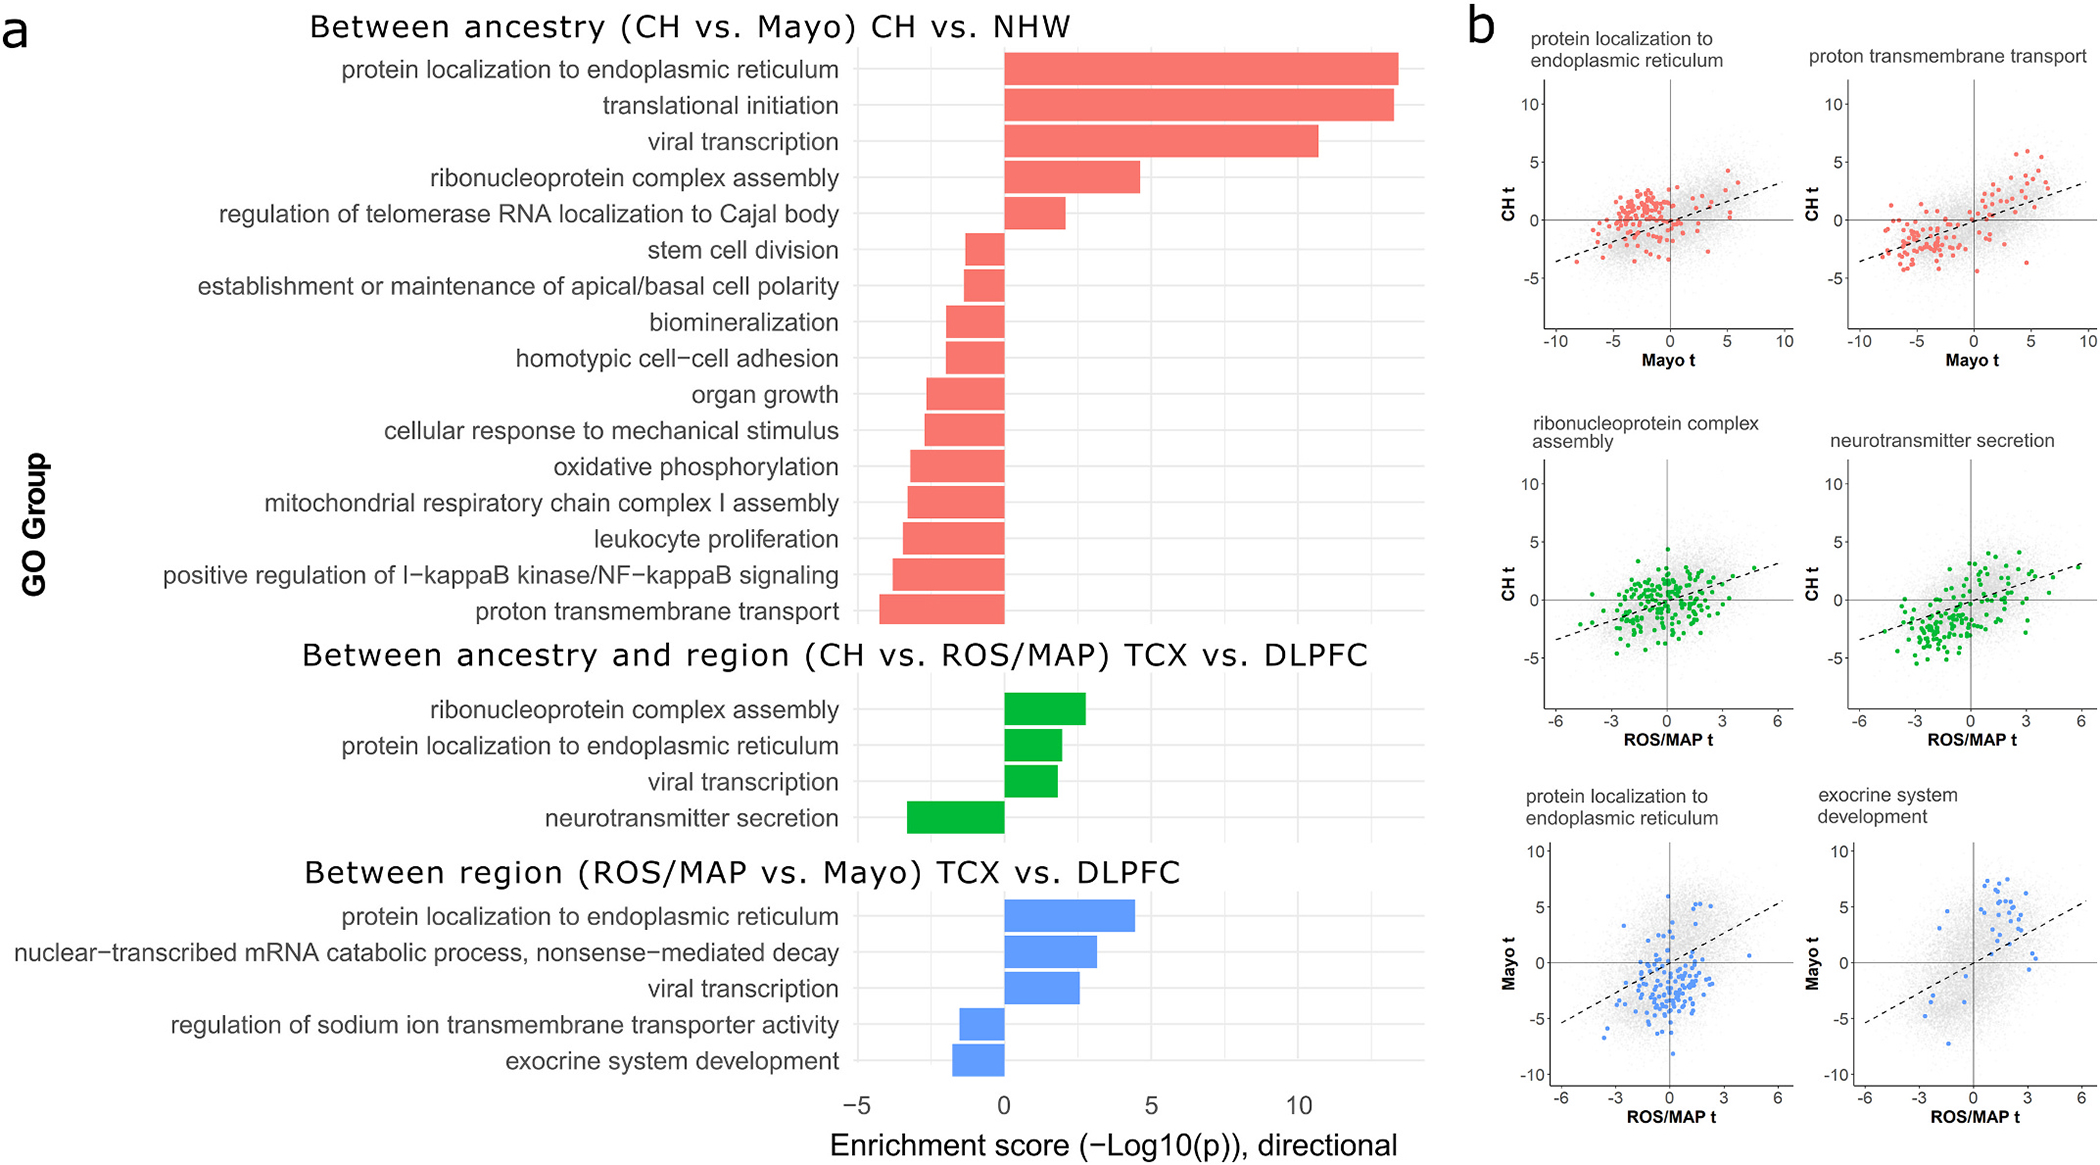
Fig. 3.

Enrichment analyses for genes with concordant and discordant LOAD effects between ancestry and brain region tissue source. A) Barplot summarizing AUC-based GO enrichment analysis using tprod ranks for all FDR-significant GO terms with a REVIGO dispensability score of 0. The x-axes indicate the enrichment −log10 (two-sided p-values), with values above 0 indicating enrichment toward higher ranks (greater discordance of between-sample effect) and values below 0 indicating enrichment toward lower tanks (greater concordance of between-sample effect). B) Scatterplots for the top discordant (left column) and concordant (right column) groups from panel A for each sample contrast, showing the LOAD differential expression t-values for genes belonging to each enriched gene set within the context of all genes. Genes belonging to labeled GO sets in panel B are colored to match the barplot in panel A. CH = Caribbean-Hispanic; FDR = false discovery rate; GO = gene ontology; DLPFC = dorsolateral prefrontal cortex source tissue; ROS/MAP = Religious Orders Study and Memory and Aging Project; TCX = temporal cortex source tissue.
