Figure 2.

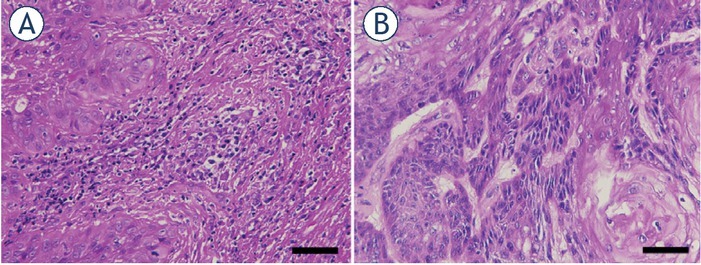
Hematoxylin and eosin stained sections of primary (A) and post-electrochemotherapy (B) biopsy. Scale bar represents 50 μm.

Hematoxylin and eosin stained sections of primary (A) and post-electrochemotherapy (B) biopsy. Scale bar represents 50 μm.