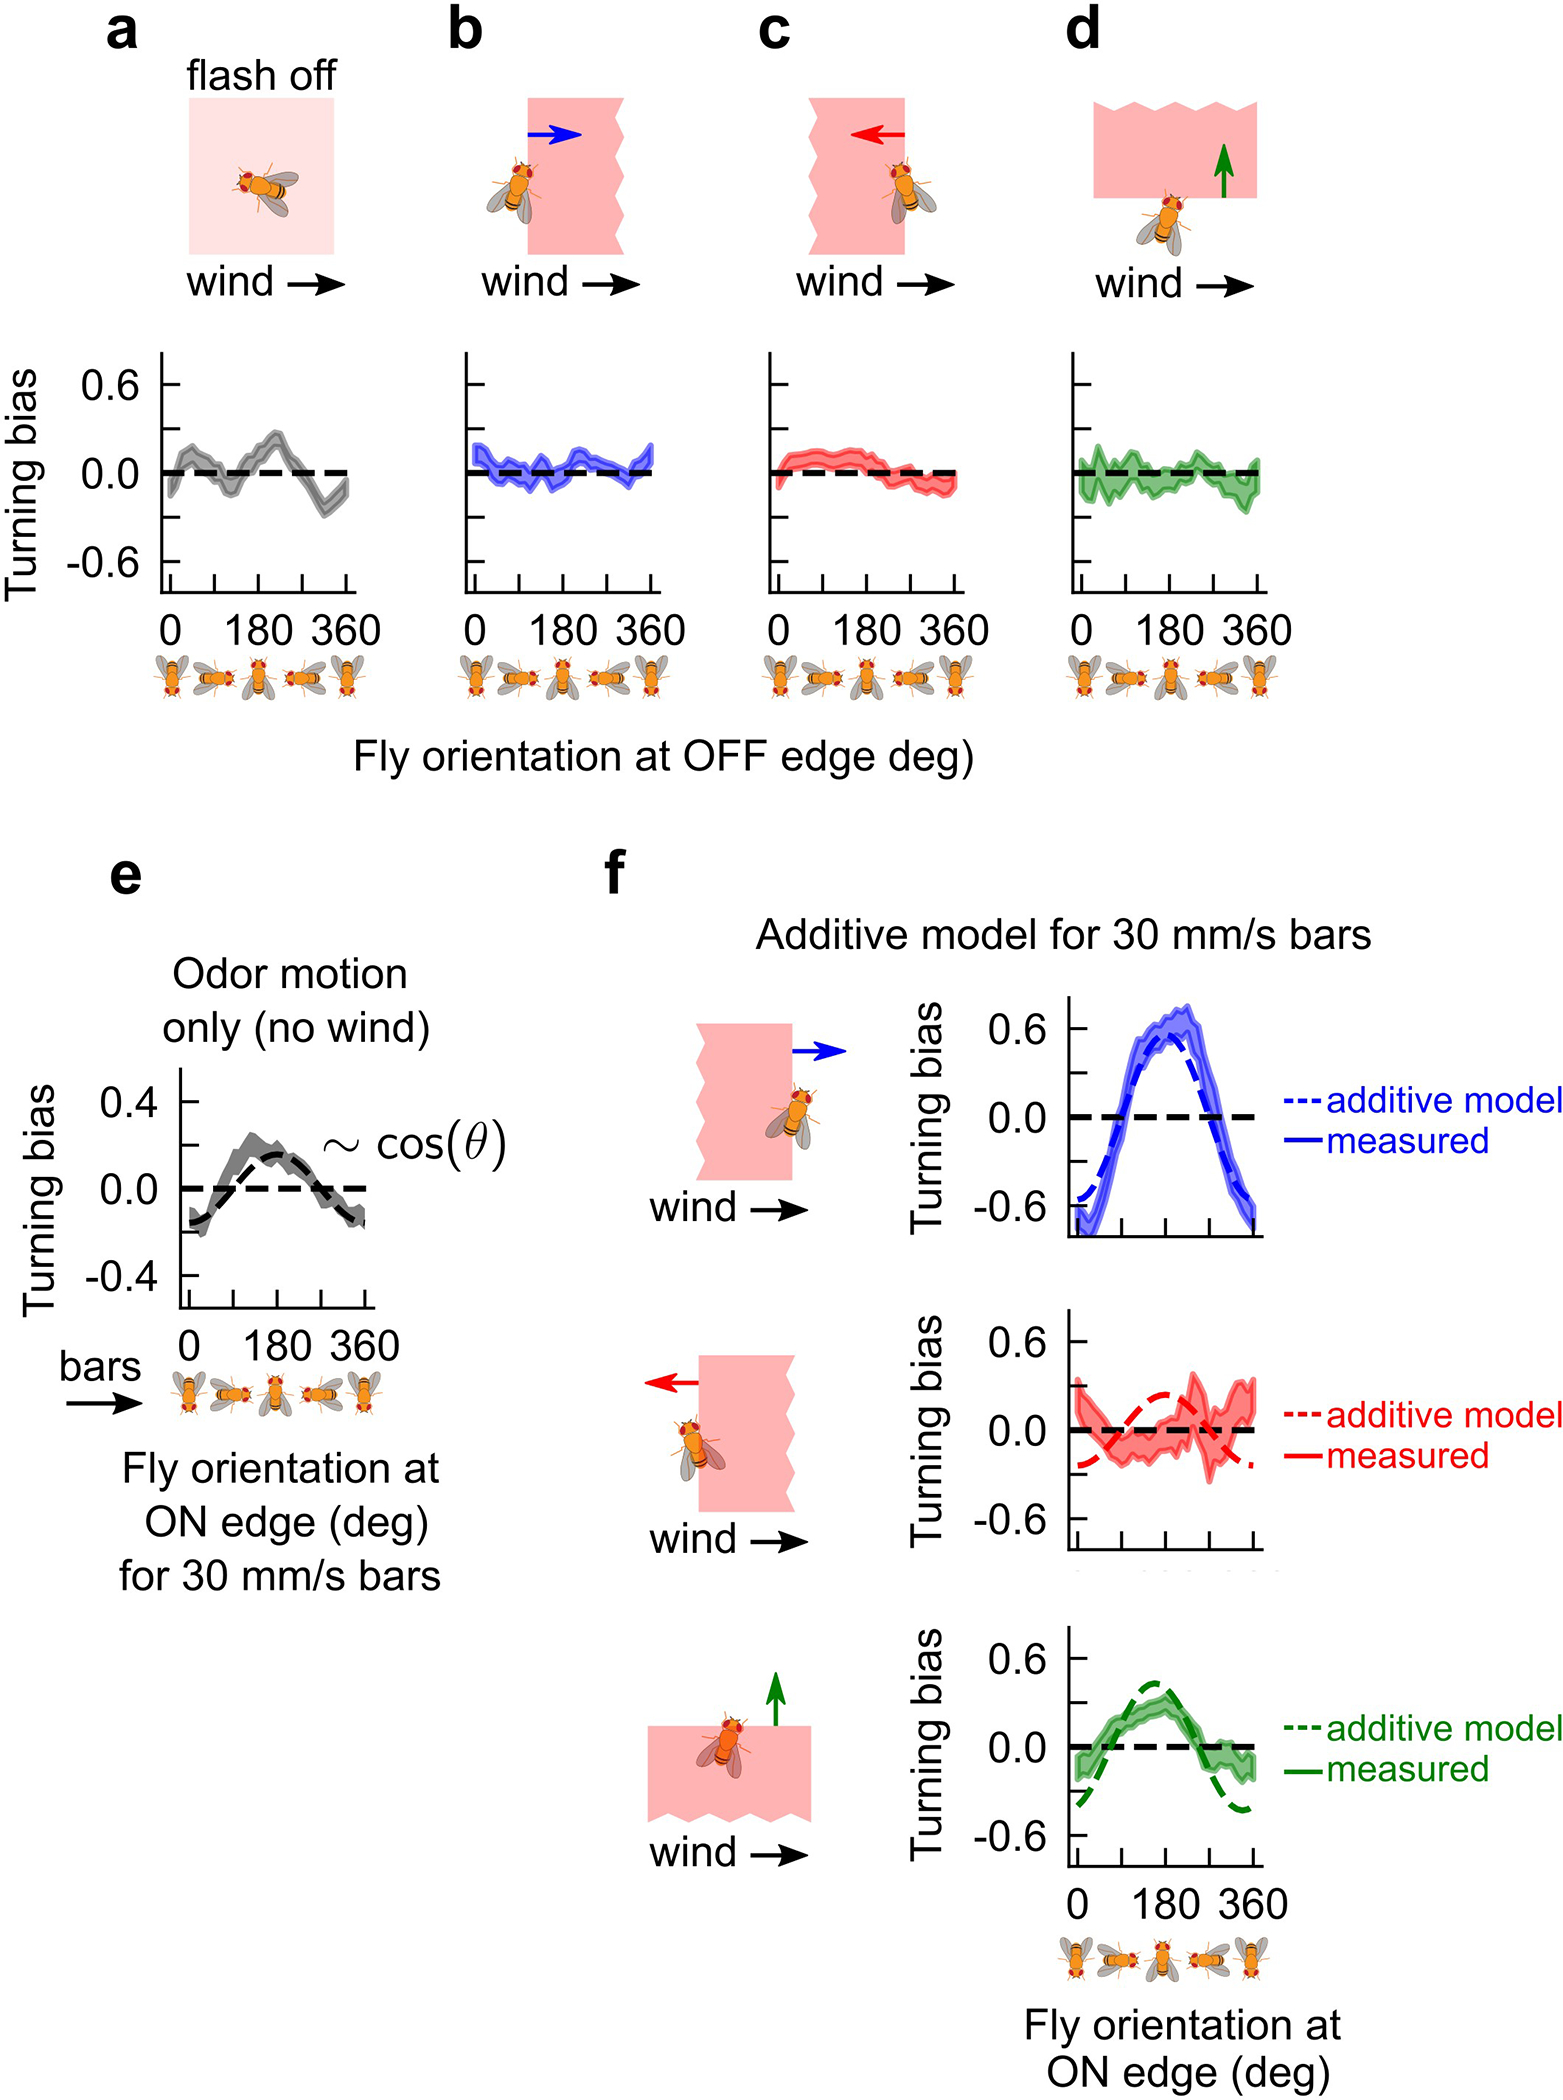
Extended Data Fig. 4. OFF edge responses with laminar and ON edge responses for fast 30 mm/s bars.

a, Turning bias versus fly orientation when bilateral optogenetic stimulus is turned off (compare first plot in Fig. 3B for flash onset). n = 1490 OFF flash hits. b-d, Fly turning bias for 15 mm/s bars moving parallel, antiparallel, and perpendicular to 150 mm/s laminar wind (compare Fig. 3d). Shaded errors: SEM. n = 1493, 1588, and 671 OFF edge encounters for bars parallel, antiparallel, and perpendicular to the wind, respectively. e, Fly turning bias vs. fly orientation at ON edge for faster 30 mm/s fictive odor bars without wind (analogous to 15 mm/s bar responses in second plot of Fig. 3b). Dotted line: fit of response to −0.16 cosθ. N = 1472 ON edge encounters. f, Additive model for ON edges of 30 mm/s bars; analogous to Fig. 3d. Solid shaded region: mean ± 1 SEM; dotted lines: additive model prediction. N = 323, 319, and 1013 ON edge encounters for odor bars with parallel, antiparallel, and perpendicular to the wind, respectively.
