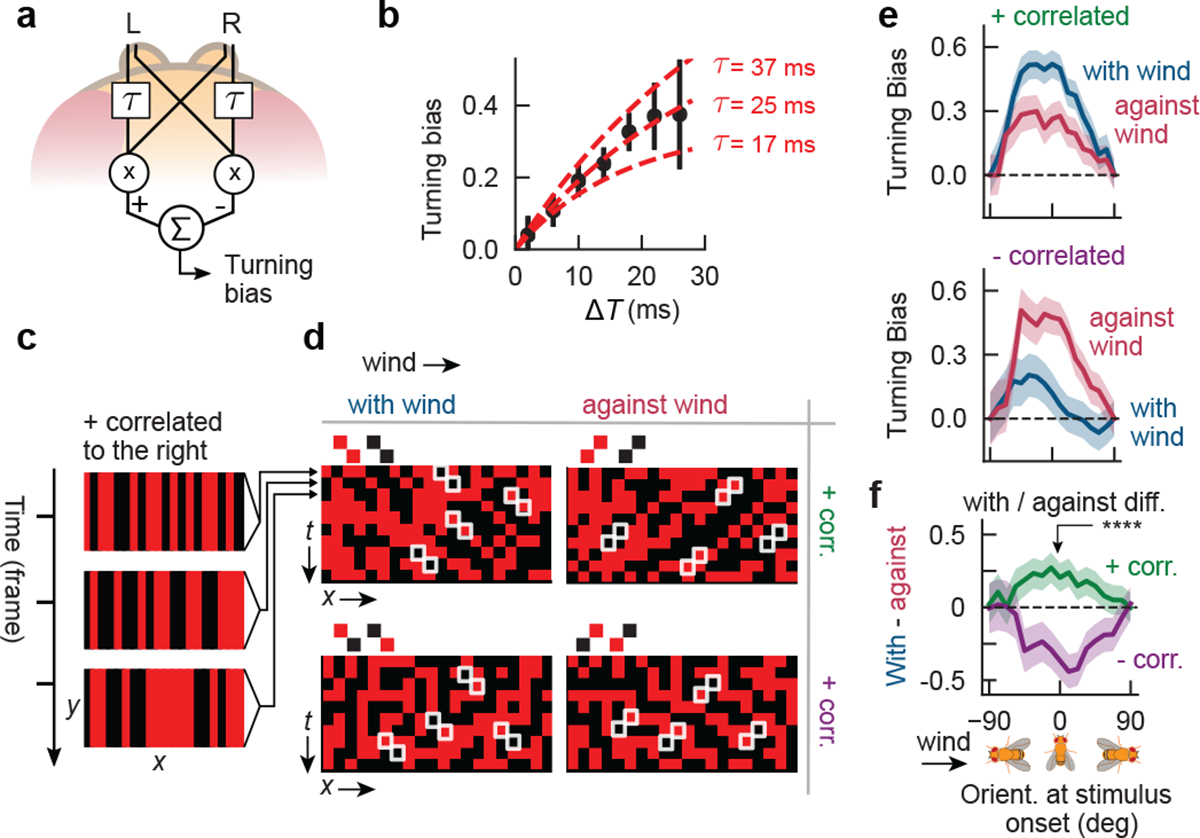
Figure 4. Odor motion sensing employs an algorithm sensitive to correlations.

a, Schematic of hypothesized HRC model in the olfactory circuit. b, Black dots: turning bias versus ΔT, using the moving bar data from Fig. 2f. Each datapoint spans ±4 ms. Middle (outer) red lines: fit of HRC model to the mean (± 1 SEM) of turning bias. n = 1475 hits. c, Correlated noise stimuli consist of 1-pixel-wide fictive odor bars. In one frame (3 frames shown), each bar is independently light or dark. Here, bars are positively correlated along +x, so a light bar at a given x in one frame is likely to be proceeded by a light bar one x-pixel to its right in the next frame. Visually, this appears as a rightward moving pattern. d, Illustration of patterns over time, for the 4 different types of correlated noise stimuli. Each pixel denotes the luminance of a bar at a given x-position, at a given time. The 4 stimulus types are defined by correlation displacement (along +x, i.e. with-wind, or along −x, i.e. against-wind) and correlation parity (+ or -). For example, for “with-wind” positively correlated stimuli, bars are correlated with their righthand neighbors in the subsequent frame – this produces red-red or black-black diagonal patterns throughout the x-t plot. e, Turning bias versus fly orientation for positively correlated (top) and negatively correlated (bottom) stimuli. Stimuli presented in 4s blocks; turning bias defined as sign of orientation change over 300 ms after stimulus onset. n = 337, 327 onset events for positively correlated with- and against-wind; n = 219, 227 for negatively correlated with- and against-wind, respectively. Shaded errors: SEM. f, Difference between with-wind and against-wind responses from e, for positive (green) and negative (purple) correlations. Curves differed significantly for θ = 0 (p <1e-6, chi-squared test).
