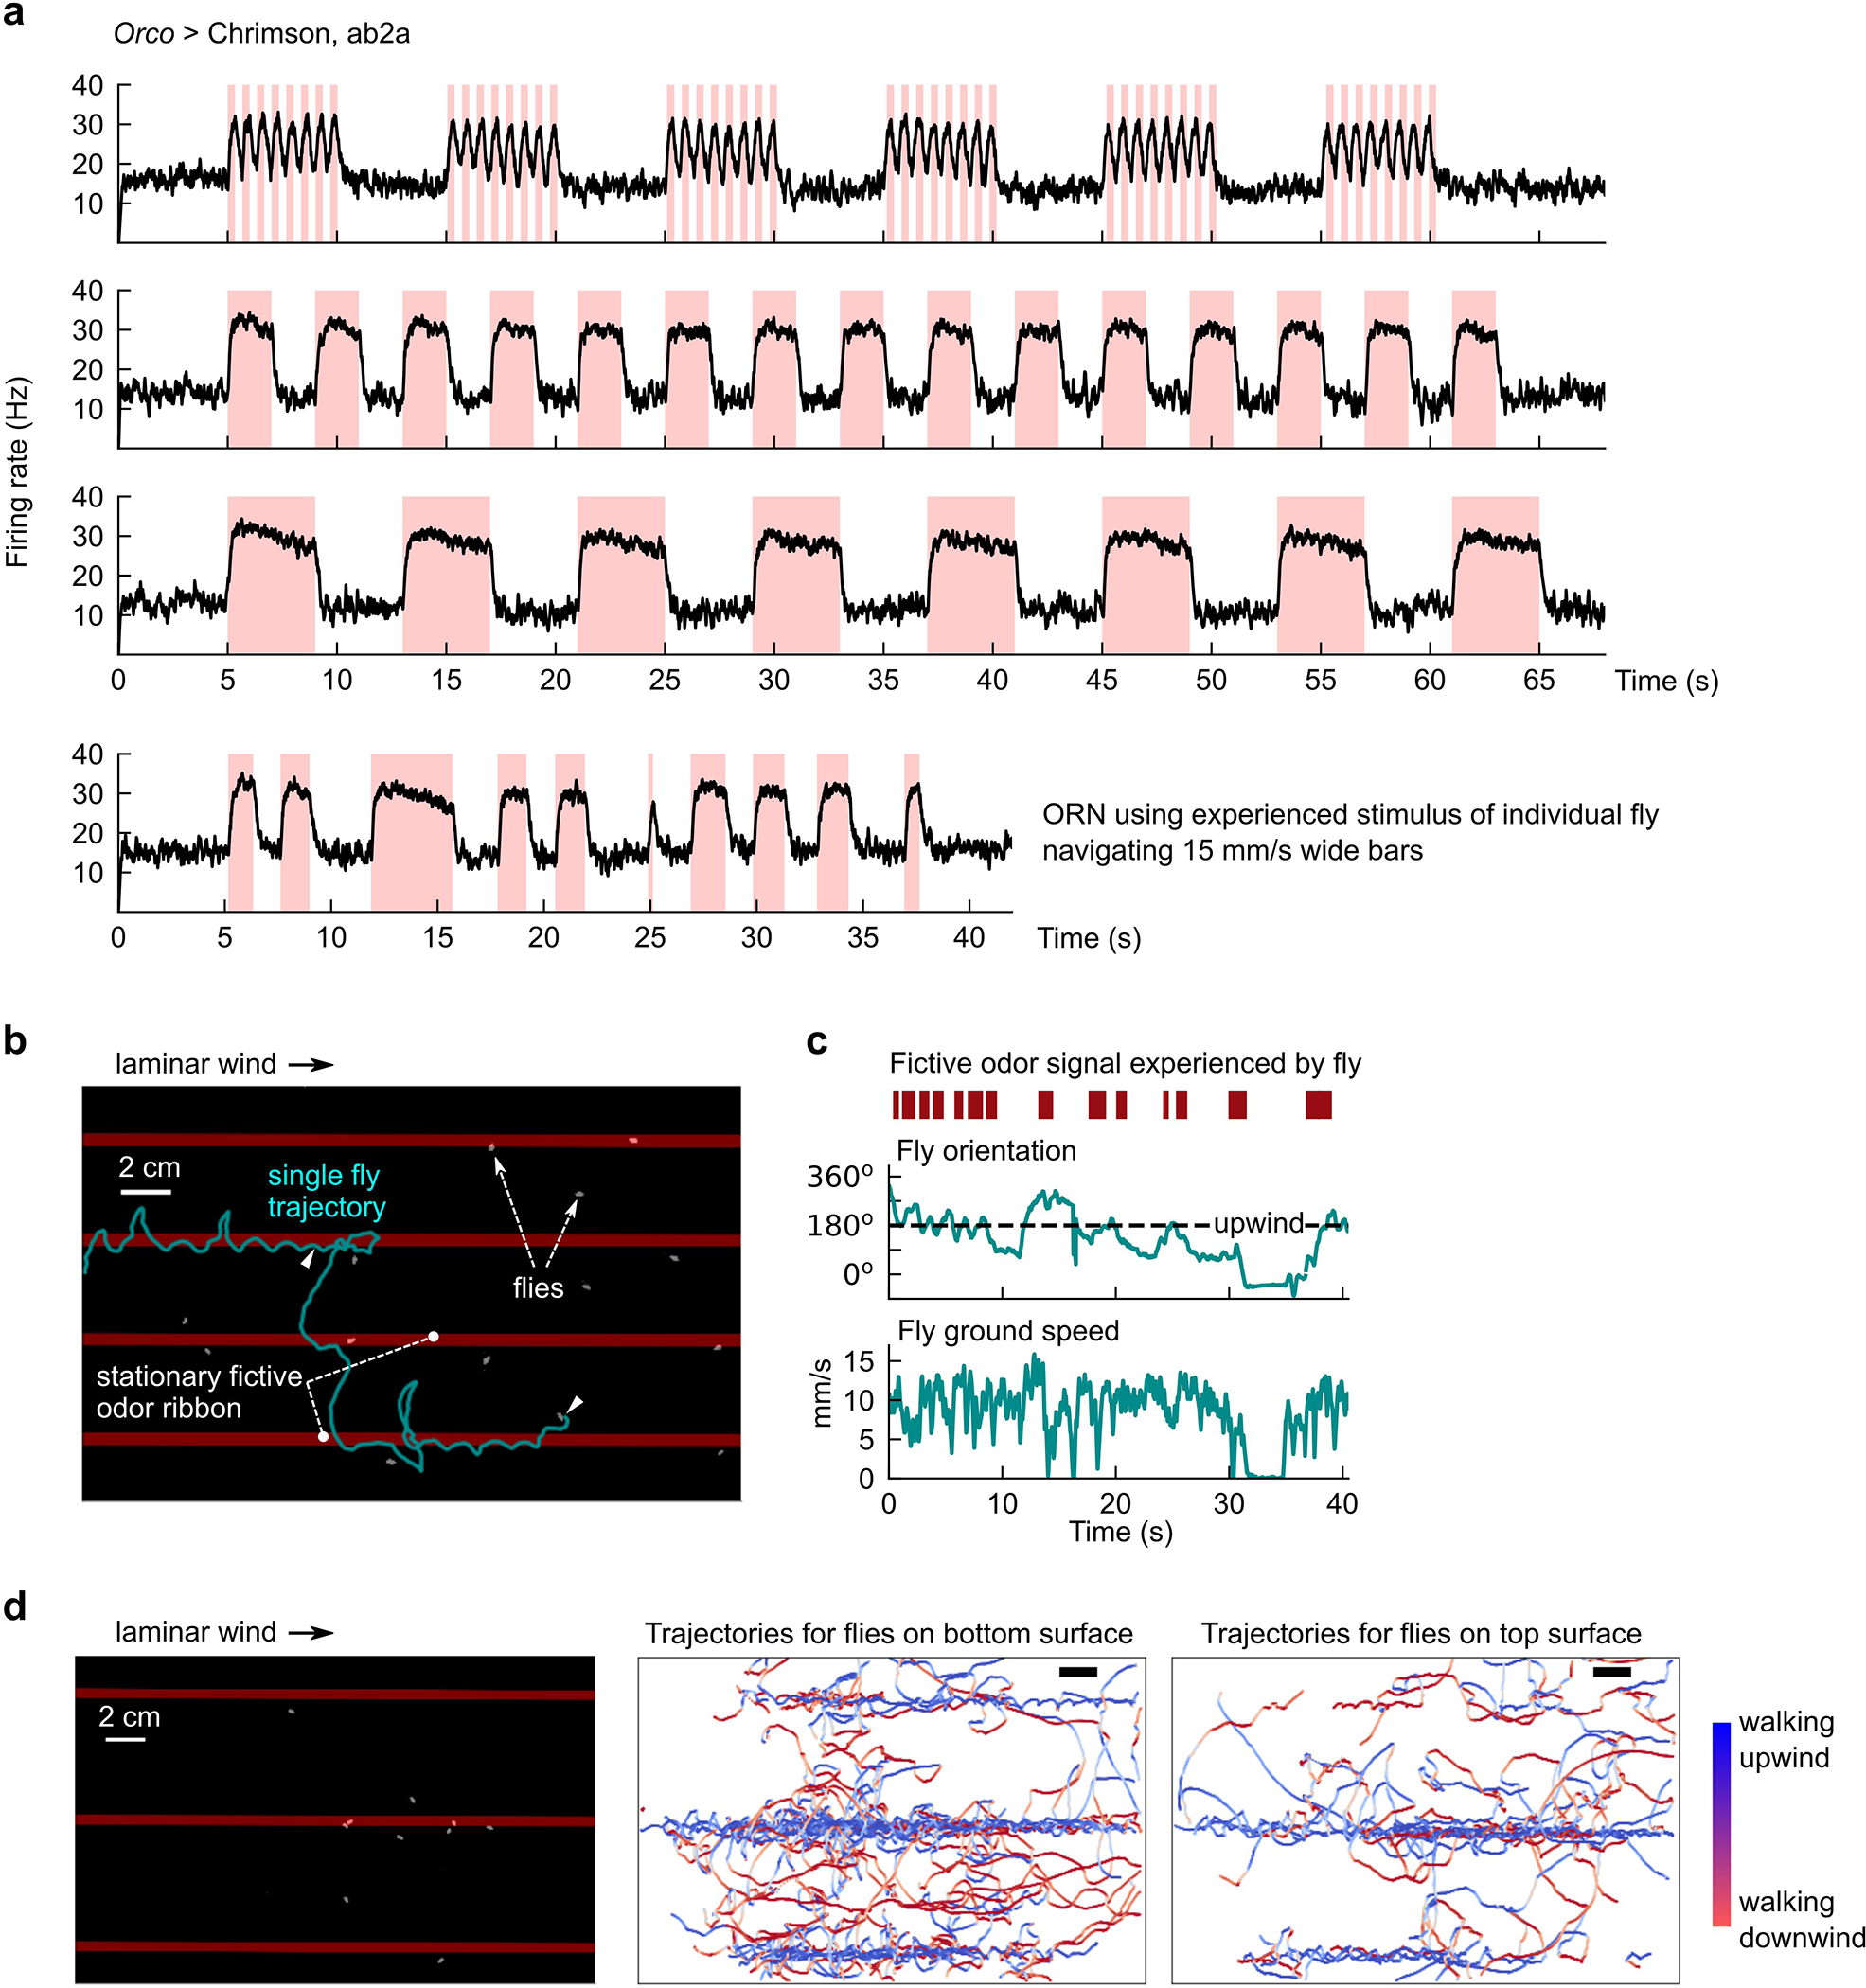
Extended Data Fig. 2. Electrophysiological and behavioral verification of optogenetic activation of Drosophila ORNs.

a, Extracellular measurements of ab2A firing rates for various odor signals mimicking those we use throughout our study. Stimuli (red shades) are delivered using a Luxeon Rebel 627 nm red LED (Lumileds Holding B.V., Amsterdam, Netherlands) at 10 uW/mm2. The frequency and duty cycle for the stimuli in the first plot are 1.5 Hz and 50% respectively, which mimics what a stationary fly in the 5 cm wide, 15 mm/s fast moving bars (Fig. 2b) would encounter. Longer stimuli approximate the experienced stimuli in the wide moving bars (Fig. 2e–f). Last plot shows the experienced stimulus and corresponding firing rate for one representative measured fly navigating 15 mm/s moving wide bars. All recordings were taken from 5 ab2a ORNs in 2 different flies. b, Illustrative track of fly following stationary fictive odor ribbons upwind. Red bars: optogenetic stimulus location – bars are overlaid on the figure, but not actually imaged since the image is IR-pass filtered. c, Fictive odor signal for fly (red bars) can be simultaneously quantified with fly behavior (teal) by aligning camera and projector coordinate systems (Methods). Plotted are the encountered fictive odor signal and behaviors for the track shown in b. d, Verification that flies on both top and bottom glass surface of assay respond similarly to fictive odor signals (here, 3 odor ribbons in laminar wind; left). Flies were manually annotated as being on the top or bottom surface. In both cases (middle and right), flies followed the fictive odor ribbons upwind, similar to behavioral responses with real odors10.
