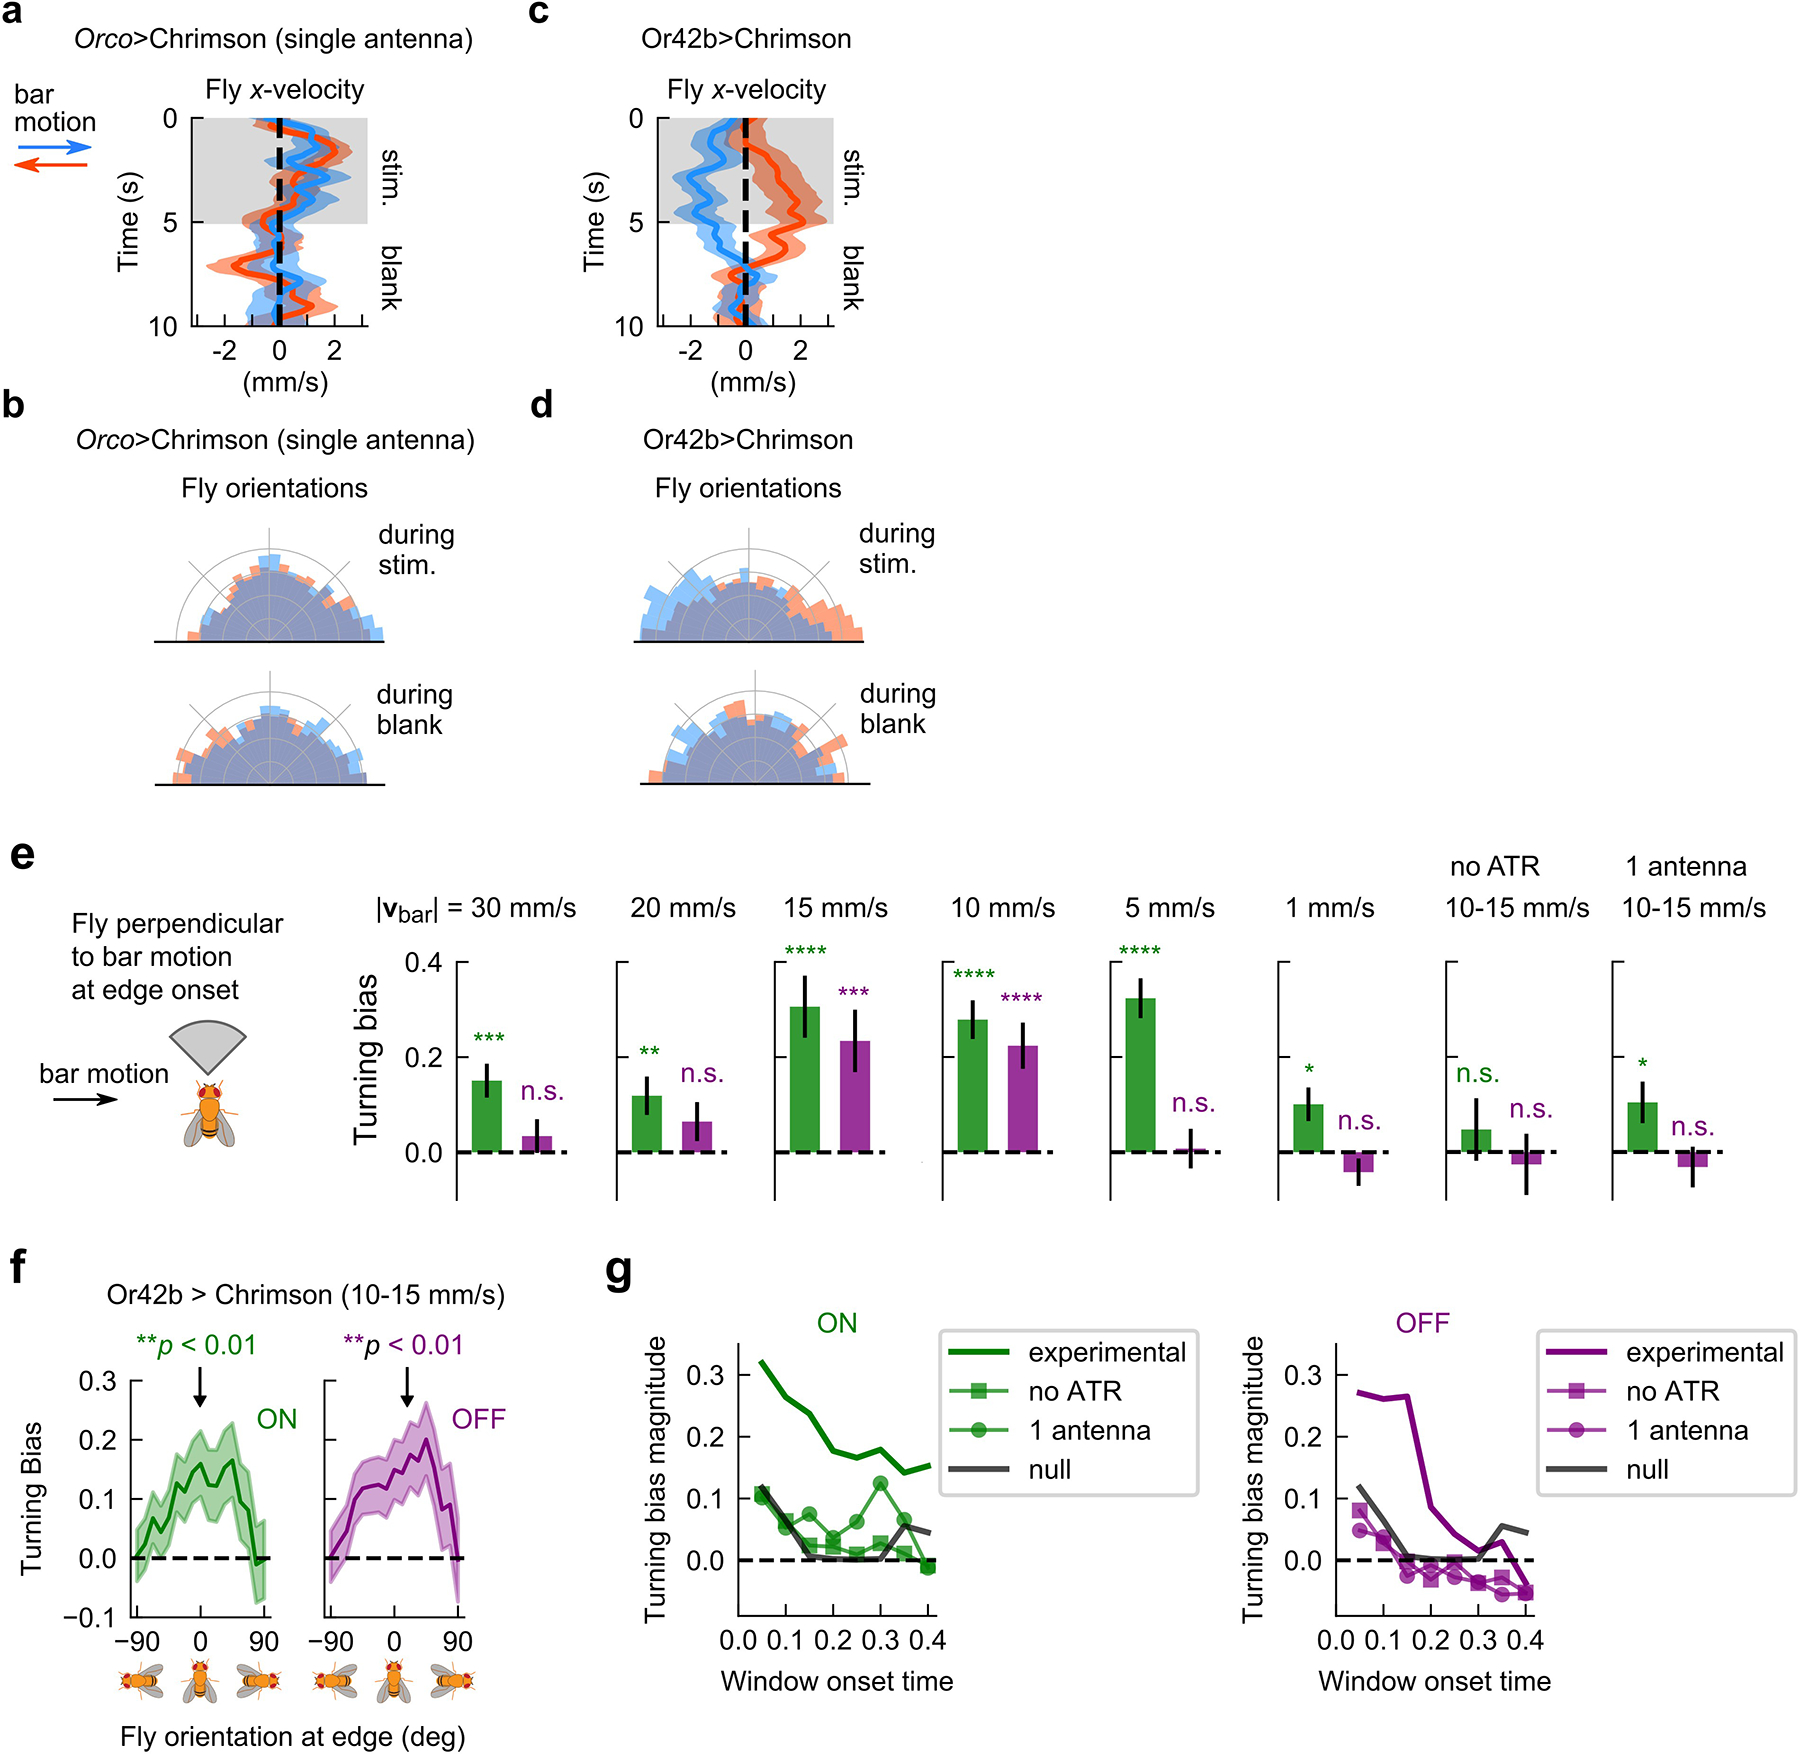
Extended Data Fig. 3. Odor direction selectivity in single antenna and single Or flies and ON/OFF edge responses across speeds and for negative controls.

a, Component of fly walking velocity along +x direction during the 5s stimulus (shaded grey) and blank periods (illustrated in Fig. 2b), in Orco>Chrimson flies that have one antenna ablated (compare to Fig. 2d). Shaded errors: SEM. Blue and orange denote rightward and leftward moving bars, respectively. Since it is difficult to distinguish flies walking on the top and bottom surface of the assay, right- and left-antenna ablated flies are pooled. n = 100, 89 tracks for rightward and leftward bar motion, respectively. Only flies oriented in the 90° sector perpendicular to the bar motion are included. b, Distribution of fly orientations during the 5s stimulus (top) and 5s blank periods (bottom), for rightward (blue) and leftward (orange) bar motion, Orco>Chrimson flies with one antenna ablated (compare Fig. 2d). Orientations are symmetrized over the x-axis. c-d, Same as a-b, for Or42b>Chrimson flies with both antennae intact. n = 37, 50 tracks for rightward and leftward bar motion, respectively. e, Turning bias for all instances that flies encounter the fictive odor ON (green) or OFF (purple) edge, for flies oriented within a 90° sector of the direction perpendicular to bar motion. Turning bias calculated as sign of fly orientation change from 150 ms to 300 ms after the edge hit. All flies are Orco>Chrimson and fed ATR (i.e. optogenetically active) except in the 7th plot, which are not fed ATR. Data are shown for bars that move at various speeds (left 6 plots), as well as for negative controls (7th and 8th plot). Error bars: SEM. P values calculated using the chi-squared test (****p < 1e4, ***p < 1e-3, **p < 1e-2, *p < 0.05). Specifically, p=9.60e-5 for n=1472 ON edge hits and p=0.23 for n=1661 OFF edge hits for 30 mm/s bars; p=3.49e-3 for n = 1167 ON edge hits and p=0.132 for n=1306 OFF edge hits for 20 mm/s; p=1.03e-6 for n = 548 ON edge hits and p=1.18e-3 for n=470 OFF edge hits for 15 mm/s; p<1e-6 for n = 1125 ON edge hits and p=1.78e-5 for n=1039 OFF edge hits for 10 mm/s; p<1e-6 for n = 1000 ON edge hits and p=0.816 for N=987 OFF edge hits for 5 mm/s; p=0.012 for n = 1284 ON edge hits and p=0.2106 for n=1633 edge hits for 1 mm/s; p=0.423 for n = 1387 ON edge hits and p=0.701 for n=1484 OFF edge hits for no ATR 10–15 mm/s; and p=0.0295 for n = 988 ON edge hits and p=0.454 for n=1153 OFF edg hits for 1 antenna 10–15 mm/s. Direction selectivity is satisfied if both ON and OFF edge responses have the same sign; gradient sensing would require opposite signs for the two edges. Data indicate that flies counterturn against the direction of fictive odor bars at both edges, within a range of bar speeds. Large ON responses for slow bar speeds are likely attributed to gradient sensing: since the direction of odor motion and gradients are the same for ON edges but opposite for OFF edges, this would give appreciable ON edge responses at slower speeds, but diminished OFF edge responses. f, Turning responses for Or42b > Chrimson flies, in which light activates only one ORN type, in response to bars moving at 10–15 mm/s. Error shades: SEM. Turning responses are consistent with direction selectivity (compare Fig. 2f). p=4.82e-3 for n = 706 ON edge hits and p=5.51e-3 for n=763 OFF edge hits. g, Dependence of results on choice of window over which turning bias is calculated. The x-axis shows the onset time of the window; the offset time was 150 ms later. The y-axis plots turning bias for flies oriented within a 90° sector of the direction perpendicular to bar motion (as in e). “Experimental” flies refer to Orco > Chrimson in response to bars moving at 10–15 mm/s (same as in Fig. 2); “no-ATR” and “1 antenna” are the same flies not fed ATR or with only 1 antenna, respectively. The “null” condition is calculated using random chosen trajectories and calculating angle changes following fictitious moving bars at random angles not actually presented to the flies. Over window onsets of 0–200 ms, the no ATR, 1 antenna and null responses are all within the same regime (< ~0.1), while the experimental responses are significantly higher. These results are consistent with previous findings. OFF response reaction times of ~500 ms have been observed9, but those were for flies counterturning back into static ribbons – the differing locomotive repertoire (flying vs. walking) and plume dynamics (static vs. dynamic) would account for this discrepancy. Reaction times of 400 ms have been observed for walking flies, but this may reflect imprecision in odor delivery6; indeed, reaction times are as low as 100 ms for tethered flies whose ORNs are stimulated optogenetically17 and as low as 85ms when ORNs are stimulated with real odors 25.
