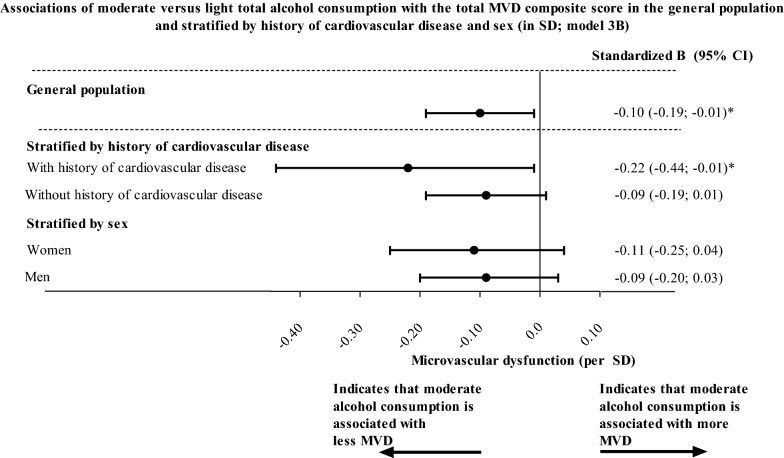
Fig. 3.
Associations of moderate versus light total alcohol consumption with the total MVD composite score in the general population. Betas and 95% confidence intervals indicate the strength of the associations of total alcohol consumption (moderate versus light) with total MVD composite score (per SD) where a negative beta indicates less MVD. The number of participants in analyses and the numerical values per SD for all endpoints are reported in the legends of Table 2 (general population), Additional file 1: Table S4 (history of cardiovascular disease strata) and Additional file 1: Table S5 (sex strata). Variables included in model 3B are age, sex (where applicable), glucose metabolism status, education level, waist circumference, smoking status, diet score, office systolic blood pressure, use of antihypertensive medication, total cholesterol/HDL cholesterol ratio, lipid-modifying medication, and history of cardiovascular disease (where applicable). *indicates P-value < 0.05. B, beta; CI: confidence interval; SD: standard deviation; MVD, microvascular dysfunction

