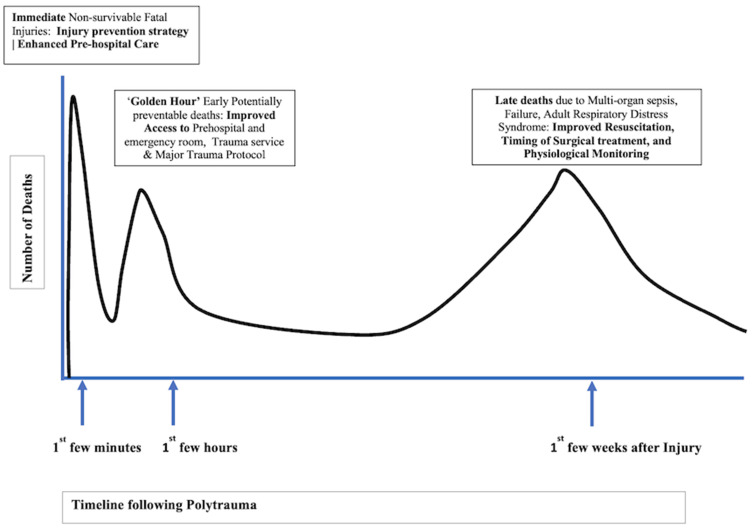
Figure 1.
The figure illustrates the “Tri-modal Peaks Distribution’ of deaths after polytrauma. The timeline of these events in on the Horizontal axis and contributed deaths on the “Y” Axis. The ‘Text boxes’ highlight the period following the trauma and suggested Interventions that can be undertaken to mitigate these Risks.

