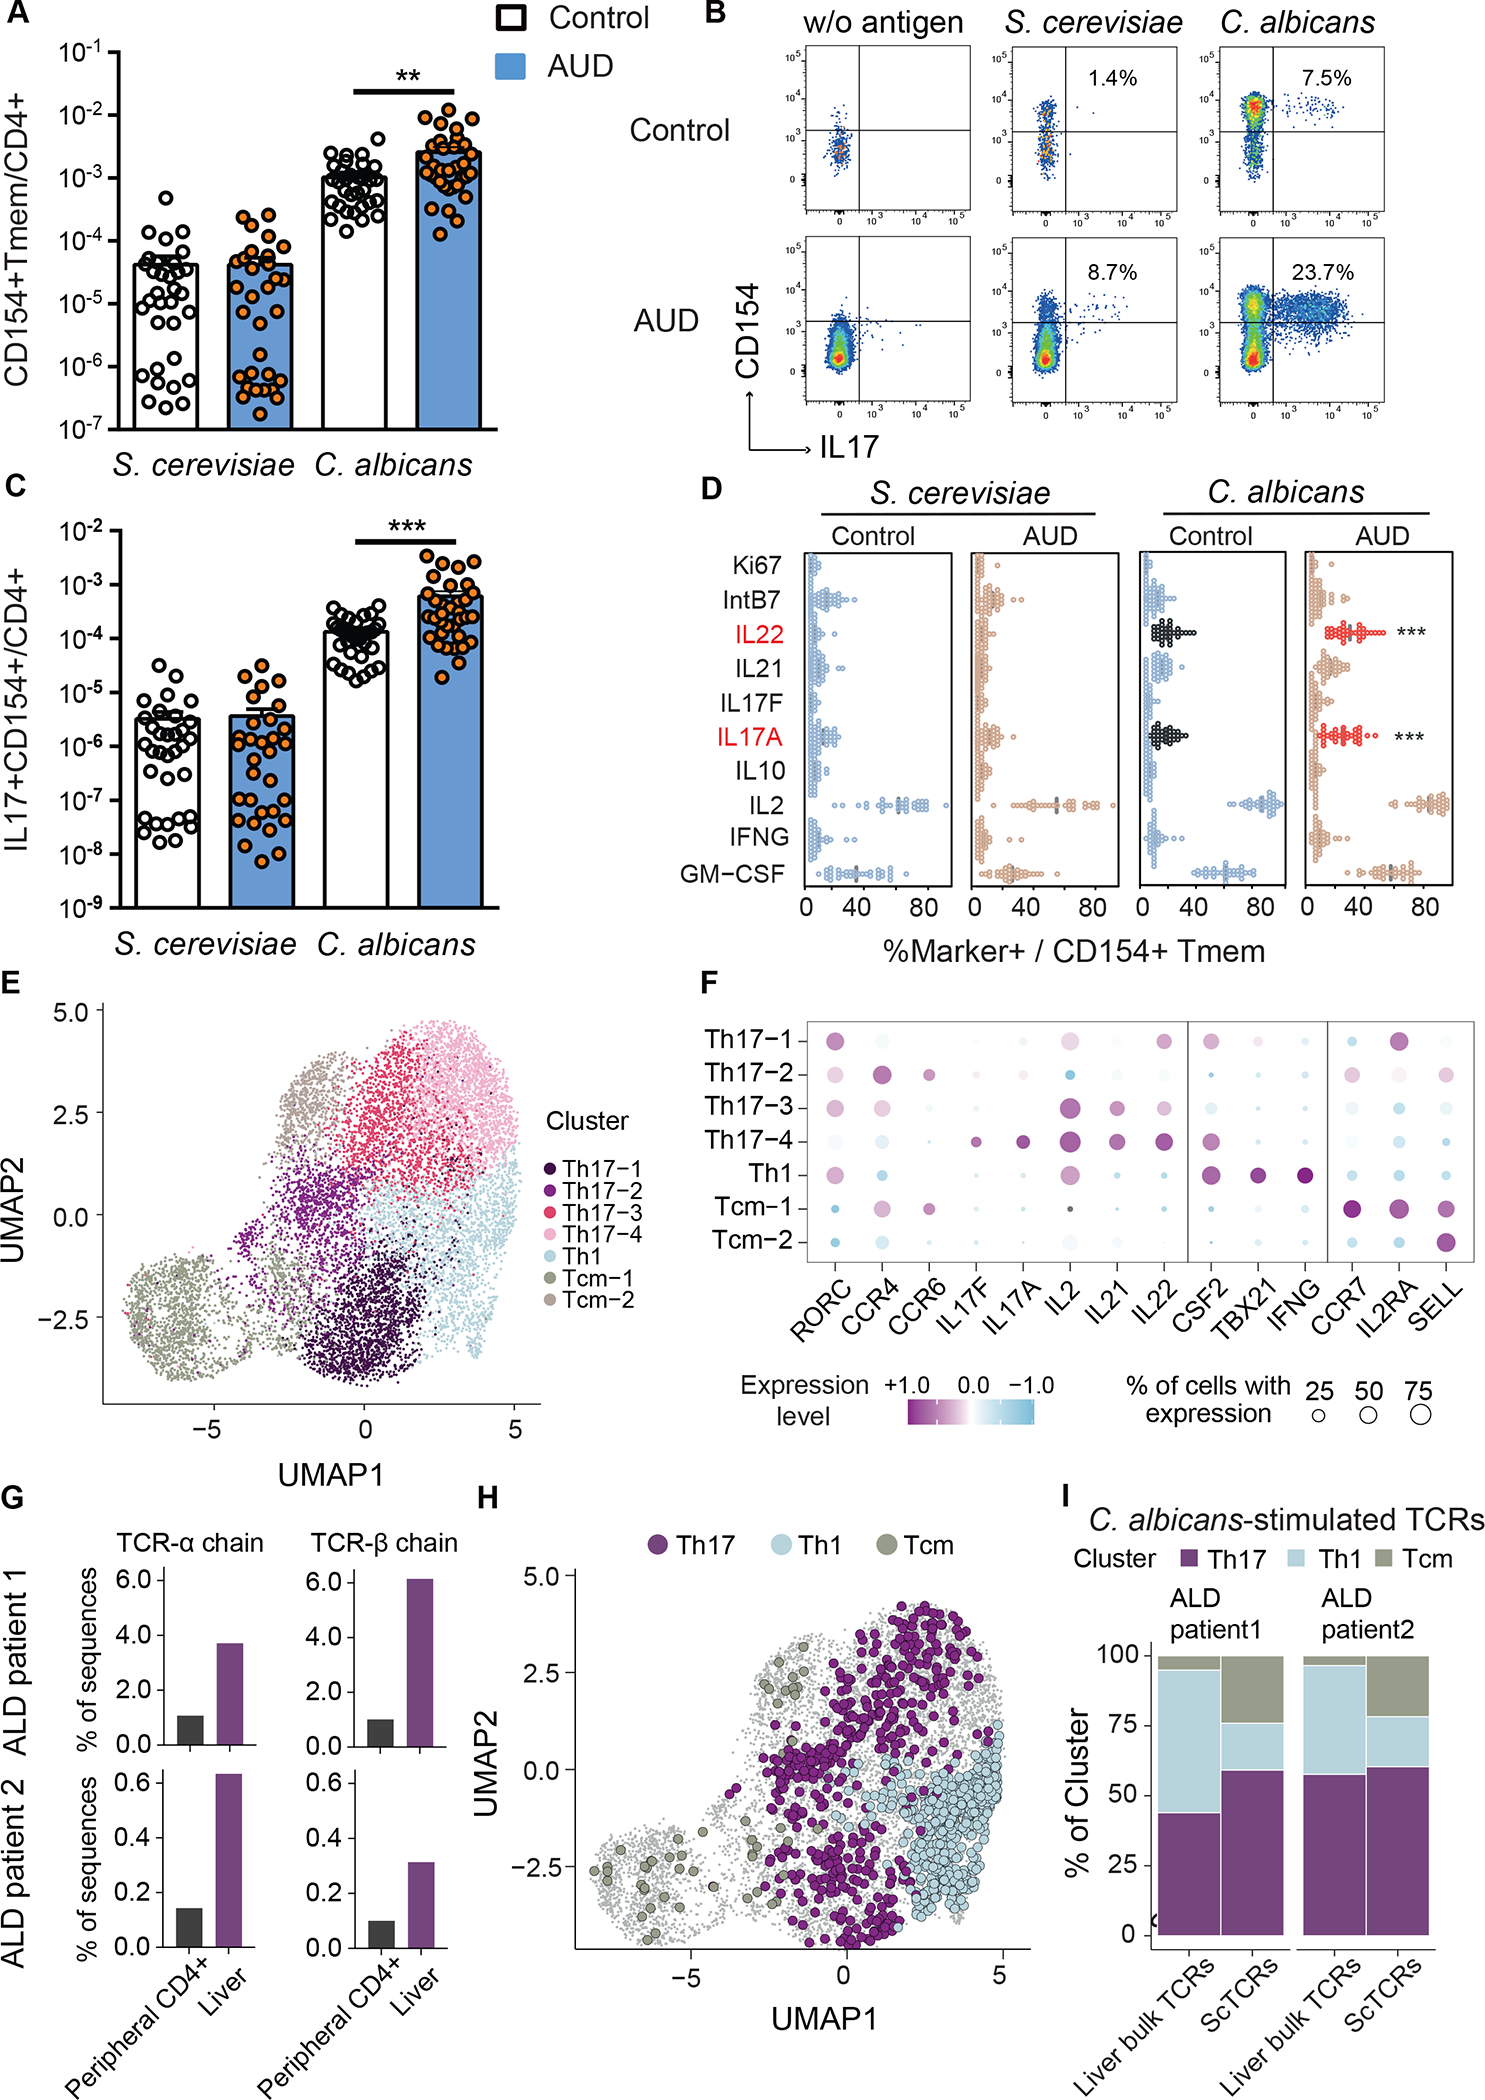
Figure 1. Patients with alcohol use disorder and liver disease have increased C. albicans-reactive Th17 responses vs non-alcoholic controls.

(A) Absolute frequencies of fungus-reactive CD154+CD45RA-memory CD4+ T cells (Tmem) in non-alcoholic controls (n=33) and patients with alcohol use disorder (AUD) and liver disease (n=36). (B) Flow cytometry plots of IL17A+CD154+ cells within CD4+ T cells. Numbers indicate percentage of IL17A+ cells within CD154+ memory T cells. (C) Absolute frequencies of fungus-reactive IL17A+ producers within total CD4+ T cells. (D) Cytokine production analyzed by ex-vivo fungus-reactive Tmem, from controls and patients with alcohol use disorder and liver disease, after stimulation with C. albicans or S. cerevisiae lysate. Relative frequencies of Ki67, IntB7, IL22, IL21, IL17F, IL17A, IL10, IL2, IFNG, GM-CSF within CD154+ Tmem are shown (%Marker+ / CD154+ Tmem). Significant differences are indicated by red text and asterisks. (E) C. albicans-stimulated CD154+ memory T cells from peripheral blood of patients with alcohol-associated liver disease (ALD) (n=2) were ex vivo FACS purified and analyzed by single-cell gene expression. UMAP visualization shows the subset composition of the C. albicans-stimulated cells colored by functional gene expression clusters. (F) Bubble plot visualization showing the gene expression of selected markers in each T cell cluster. Colors represent the Z-score normalized gene expression and the size of the bubbles indicates the proportion of cells expressing the respective genes. (G) Bulk TCR sequencing was performed from bulk liver biopsies and total CD4+ T cells from blood of the same individuals as the C. albicans scRNA seq dataset. Proportions of C. albicans-stimulated TCR-alpha and beta sequences within the liver and peripheral CD4+ T cells are shown for both donors. (H) C. albicans-stimulated TCR clonotypes showed identical TCR sequences with bulk TCR data from the liver samples are highlighted in the UMAP plot and color-coded according to the identified functional clusters. (I) Phenotype distribution of C. albicans-stimulated clonotypes showed identical TCR sequences with liver samples compared to total of C. albicans-stimulated clonotypes from PBMCs. Figure 1A–D was performed in 12 independent experiments with 2–5 patients and controls each time. Results are expressed as mean±SEM. P value determined by 1-way ANOVA with Holm-Sidak post-hoc test. **P<0.01, ***P<0.001. See also Figure S1.
