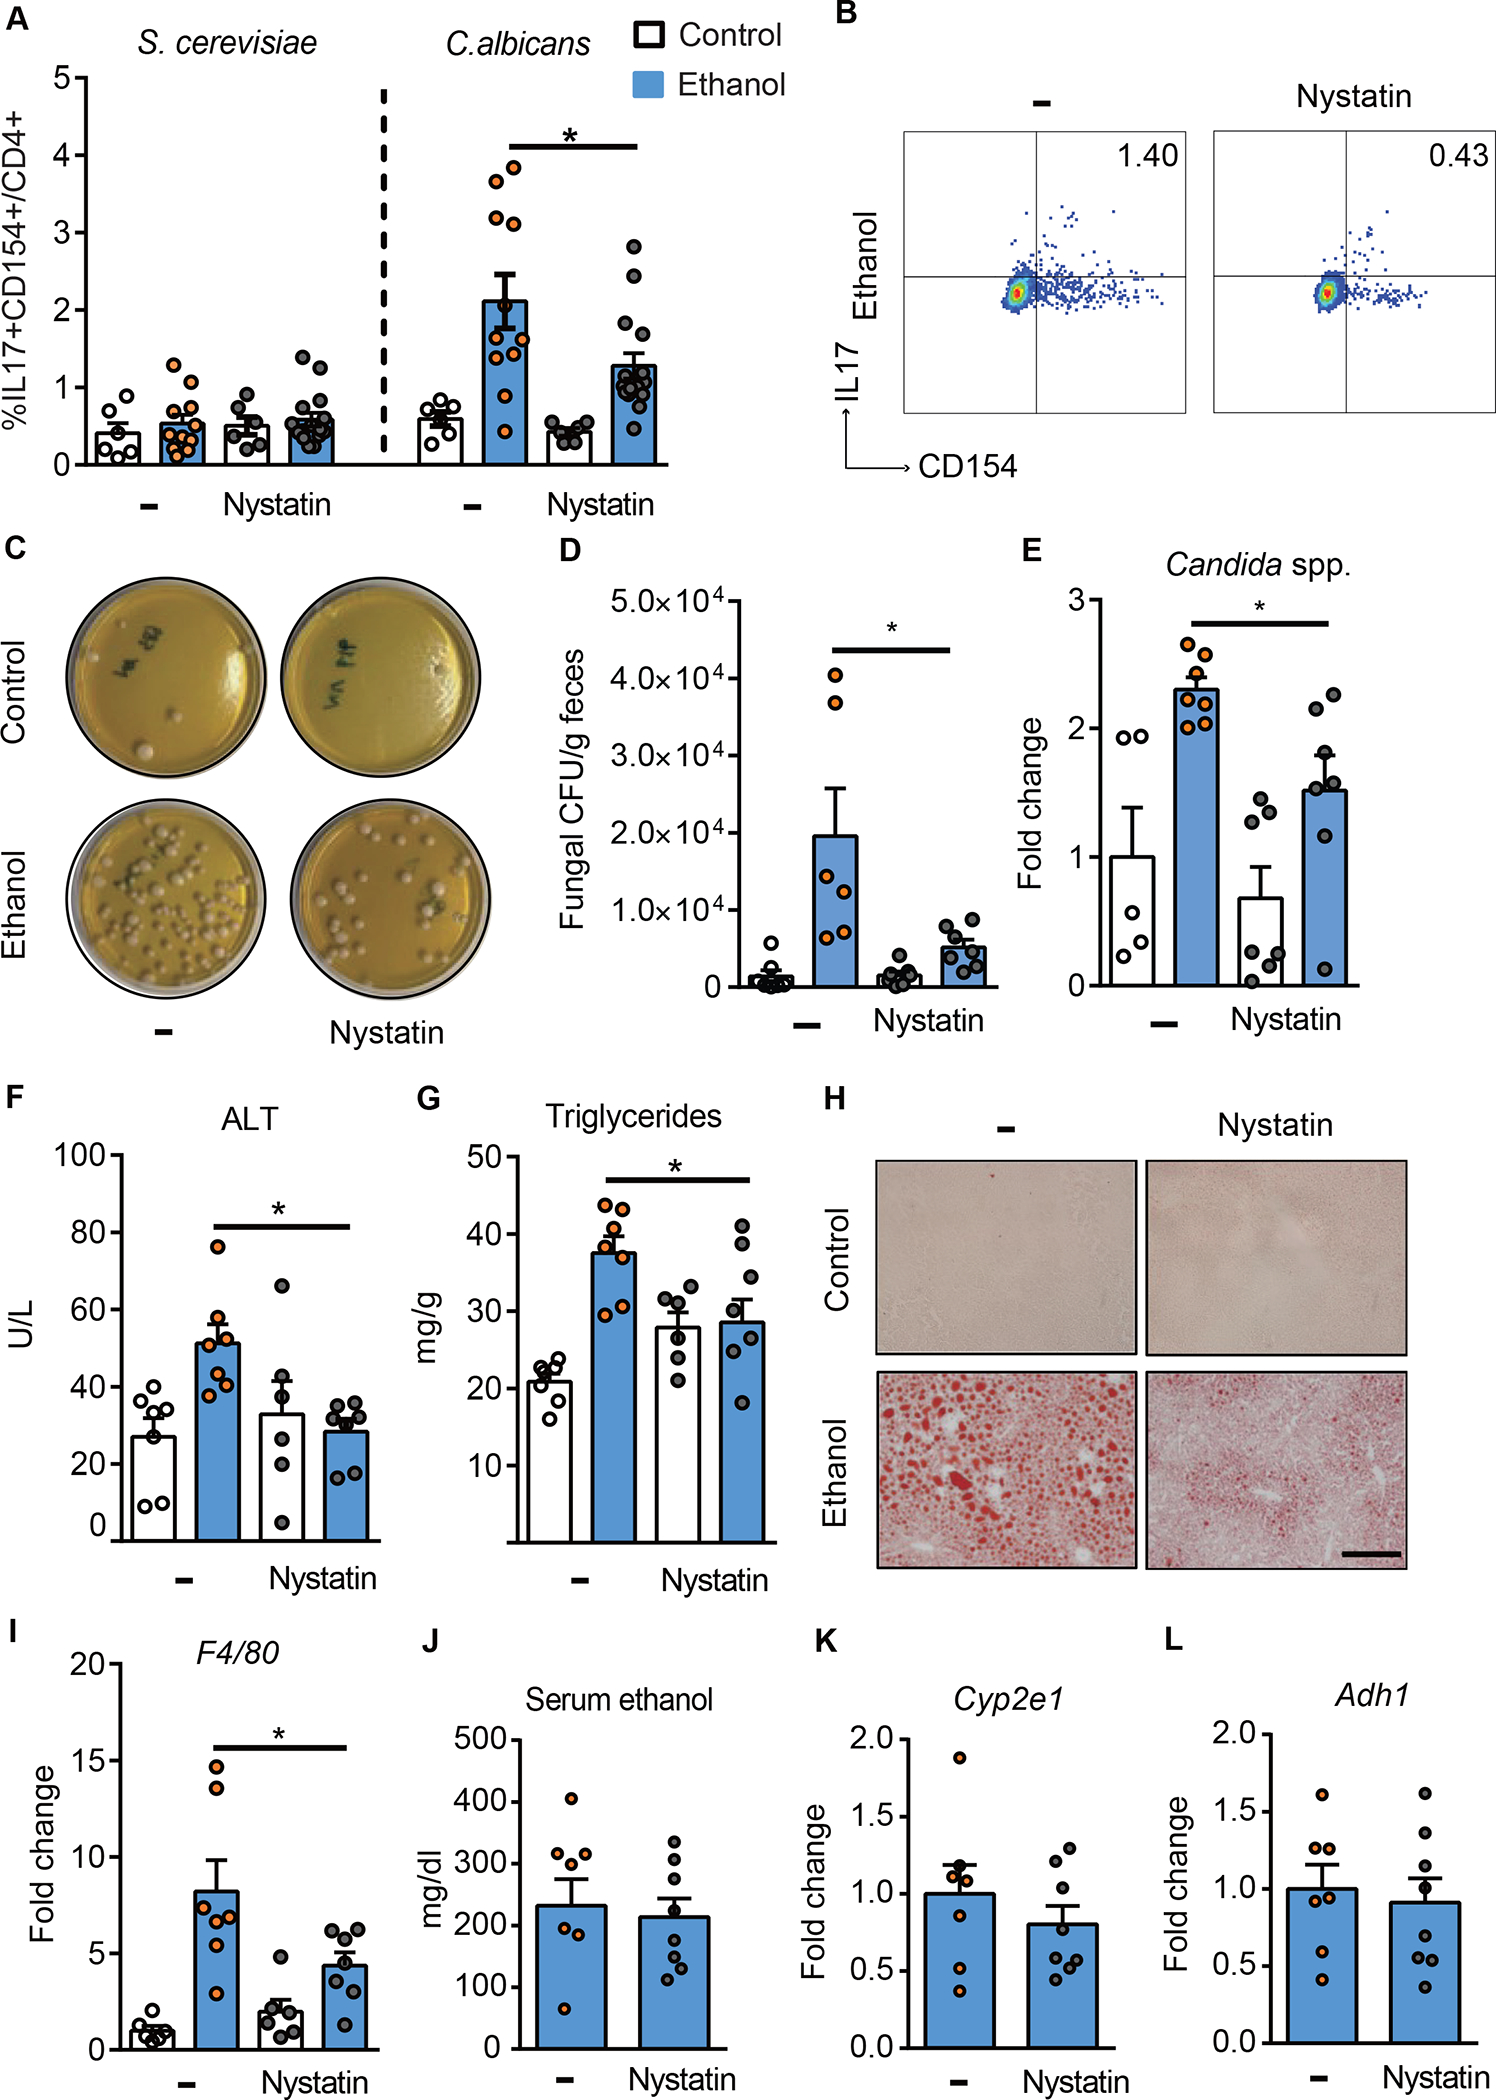
Figure 3. Antifungal agent reduces hepatic C. albicans-activated Th17 cells and attenuates ethanol-induced liver disease in mice.

(A-B) C57BL/6 mice were fed a chronic plus-binge ethanol diet (NIAAA model) or an isocaloric (control) diet, with or without the anti-fungal drug nystatin. (A) Fungus-activated Th17 cells in liver detected after isolation of mononuclear cells, following 6 hrs ex vivo stimulation with C. albicans or S. cerevisiae lysate. (B) Flow cytometry plots of IL17A+CD154+ cells among CD4+ T cells. (C–L) C57BL/6 mice were placed on a chronic Lieber DeCarli diet or control diet for 8 weeks. Diets were supplemented with or without nystatin for the last 10 days. (C) Fecal samples from controls and ethanol-fed mice were cultured on YPD agar plates with antibiotics; representative agar plates are shown. (D) Colony forming units (CFUs) of fungi in fecal samples were counted. (E) Fecal fungal DNA was extracted, and the abundance of Candida spp. was detected by qPCR. Fold change was calculated relative to vehicle-treated mice on control diet. (F) Serum levels of ALT. (G) Hepatic triglyceride content. (H) Representative oil red O staining of liver sections (scale bar, 100 μm). (I) Hepatic levels of F4/80 mRNA. (J) Serum levels of ethanol. (K and L) Hepatic levels of Cyp2e1 and Adh1 mRNAs. Figure 3A–B was performed in 3 independent experiments. Figure 3C–L was conducted in 2 independent experiments. Results are expressed as mean±SEM. P values between groups of mice fed the ethanol diet, with vs without nystatin, were determined by 2-way ANOVA with Tukeýs post-hoc test (A, D, E, F, G, and I) or 2-sided Student t test (J-L). *P<0.05. See also Figure S3.
