
Figure 3-. Functional characterization of TYRP1 alleles.
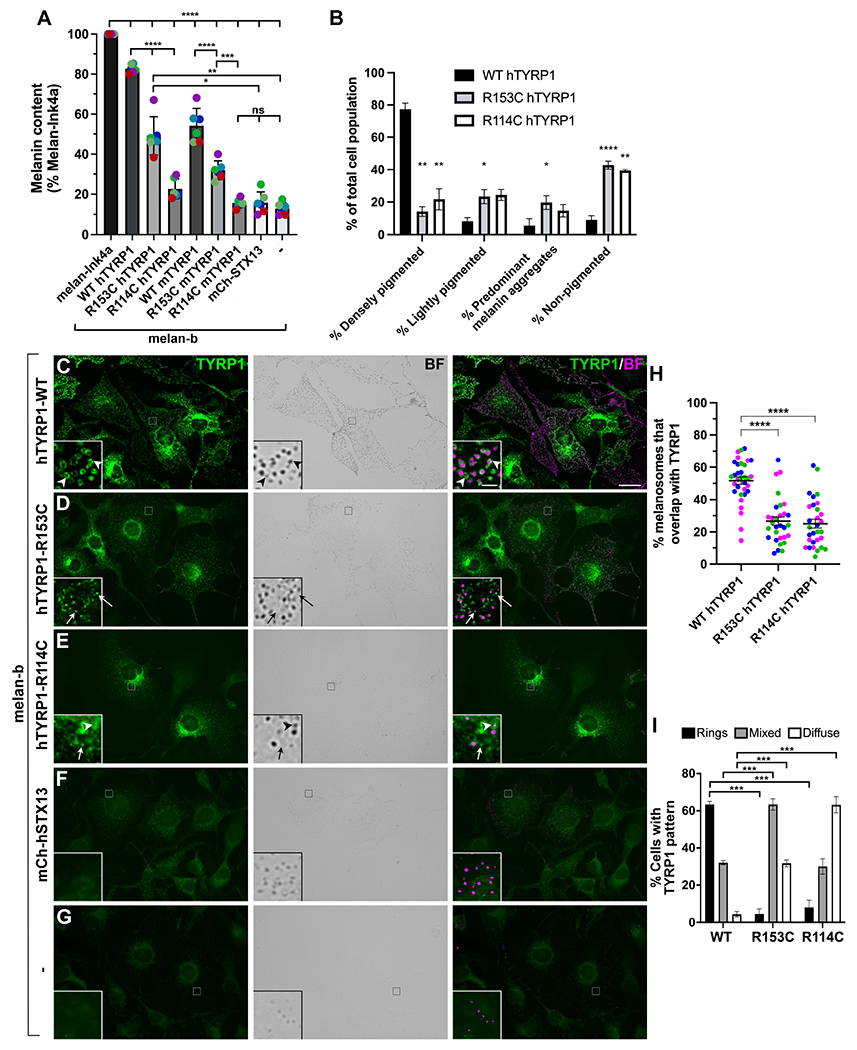
(A) TYRP1-deficient melan-b cells that were untransduced (−) or stably expressed the WT, R153C, or R114C variants of human (h) or mouse (m) TYRP1 or mCh-STX13 as a control were analyzed by quantitative melanin content assay and normalized to protein content. Data represent percent normalized melanin content relative to that of WT melan-Ink4a cells from six experiments (colored dots), each performed in duplicate, and analyzed by two-way ANOVA and Tukey’s multiple comparison test. (B) Stable melan-b transductants expressing WT, R153C, or R114C hTYRP1 variants were analyzed by bright field microscopy, and individual cells were characterized as densely pigmented, lightly pigmented, light with dense aggregates, or non-pigmented. Data from three experiments with 200 of each cell type per experiment were analyzed by a mixed effect analysis with Tukey’s multiple comparison test relative to WT hTYRP1. (C-I). Indicated untransduced (-; G) or stable melan-b transductants (C-F) were analyzed by immunofluorescence microscopy for TYRP1 (left, green) and bright field microscopy (BF) for pigment granules (middle); right, overlay with pigment granules pseudocolored magenta. Insets, 7X magnification of boxed regions (intensities of TYRP1 and pigment granules optimized to better visualized overlap). Arrowheads, TYRP1 in rings around pigment granules; arrows, TYRP1 in separate punctate structures. (H) Quantification of cellular pattern of TYRP1 as predominantly rings, diffuse/punctate, or mixed among transduced cells expressing each of the TYRP1 variants. Data from four experiments with 150 of each cell type per experiment were analyzed by two-way ANOVA with Dunnett’s multiple comparison test relative to WT TYRP1. (I) Quantification of the percent of melanin-containing structures within densely pigmented cells that overlapped with TYRP1. Data from three experiments with 8-14 cells of each type (at least 30 total) per experiment were analyzed by Kruskal-Wallis with Dunn’s multiple comparison tests.