
Figure 6-. Simulation models of population allele frequencies under increasing selection coefficients.
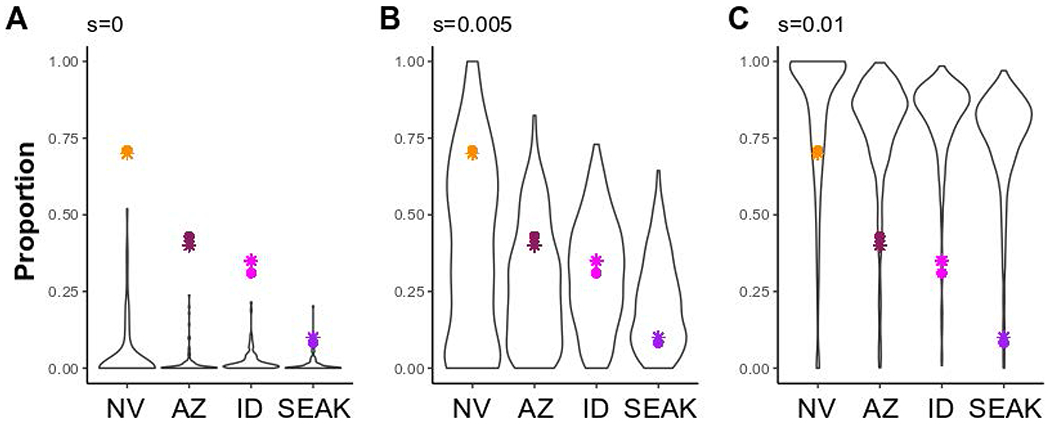
Simulation models for the frequency of a derived allele (h = 0.75) following 1,440 generations in four populations of Ursus americanus (Nevada: NV; Arizona: AZ; Idaho: ID; and Southeast Alaska: SEAK) connected via gene flow (see Figure S8). Models varied by selection coefficients (s; A- 0; B- 0.005; and C- 0.01), and accounted for population expansion and bottlenecks. Each simulation model was run for 1,000 iterations and panels represent runs in which the derived allele did not go extinct within a run; thus, sample size varies (A- 95; B- 394; and C- 614). Colored points represent R153C genotypic frequencies (circles) estimated in this study for each respective population, or phenotypic frequencies (stars) inferred from contour maps5.