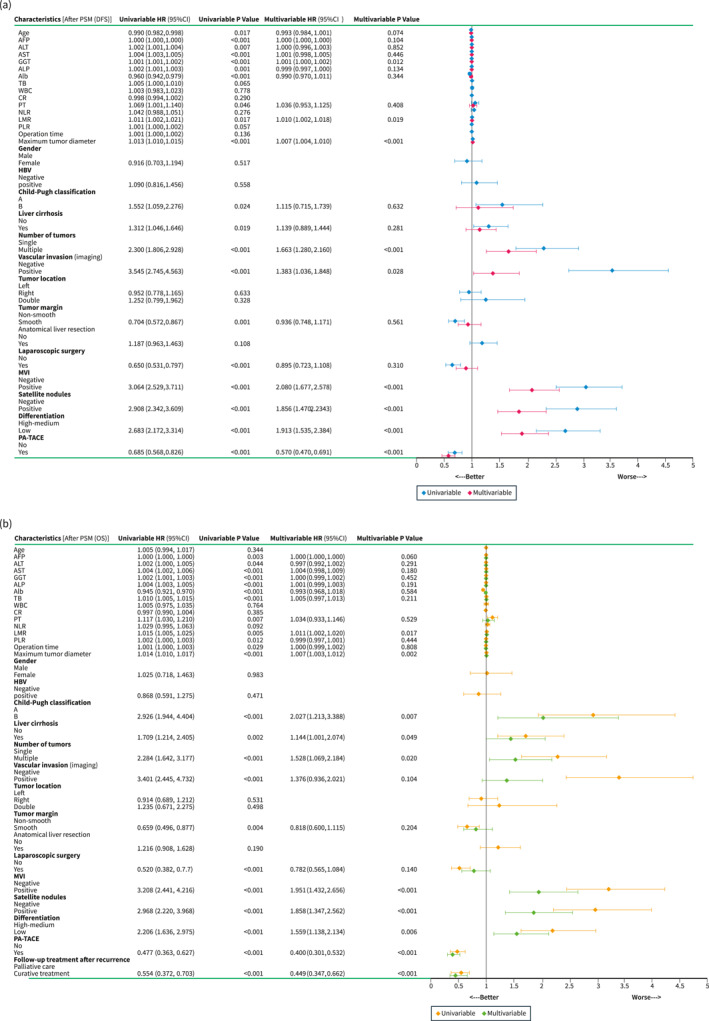
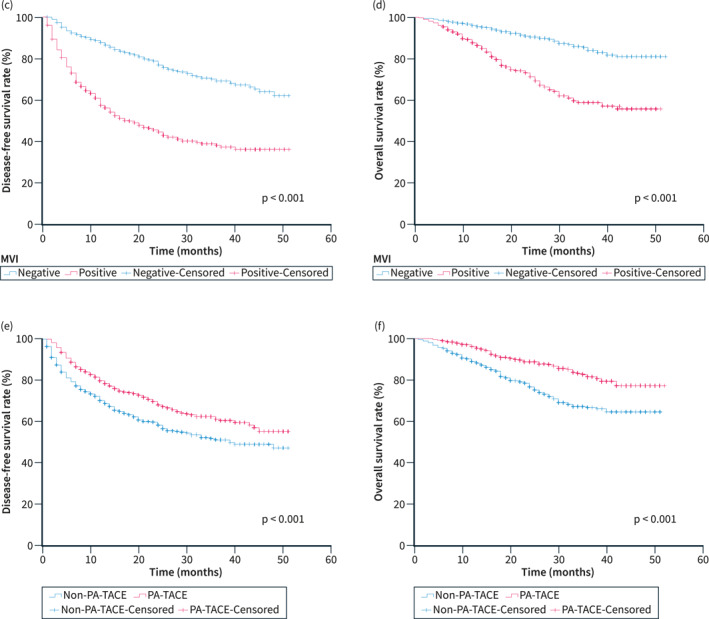
FIGURE 1.
Forest plots of univariate and multivariate analysis of Cox regression models for DFS (a) and OS (b) in patients with HCC after PSM. Curves of DFS (c) and OS (d) for all patients with or without MVI after PSM. Curves of DFS (e) and OS (f) for all patients with or without PA‐TACE after PSM. AFP, Alpha‐fetoprotein; Alb, Albumin; ALP, Alkaline phosphatase; ALT, Alanine aminotransferase; AST, Aspartate aminotransferase; Cl, Confidence interval; CR, Creatinine; DFS, Disease‐free survival; GGT, Gamma‐glutamyltransferase; HBV, Hepatitis B virus; HCC, Hepatocellular carcinoma; HR, Hazard ratio; LMR, Lymphocyte‐to‐monocyte ratio; MVI, Microvascular invasion; NLR, Neutrophil‐to‐lymphocyte ratio; OS, Overall survival; PA‐TACE, Postoperative adjuvant transarterial chemoembolisation; PLR, Platelet‐to‐lymphocyte ratio; PSM, Propensity score matching; PT, Prothrombin time; TB, Total bilirubin; WBC, White blood cell.